How a City Weathers a Disaster: Lessons from Bank Receipts
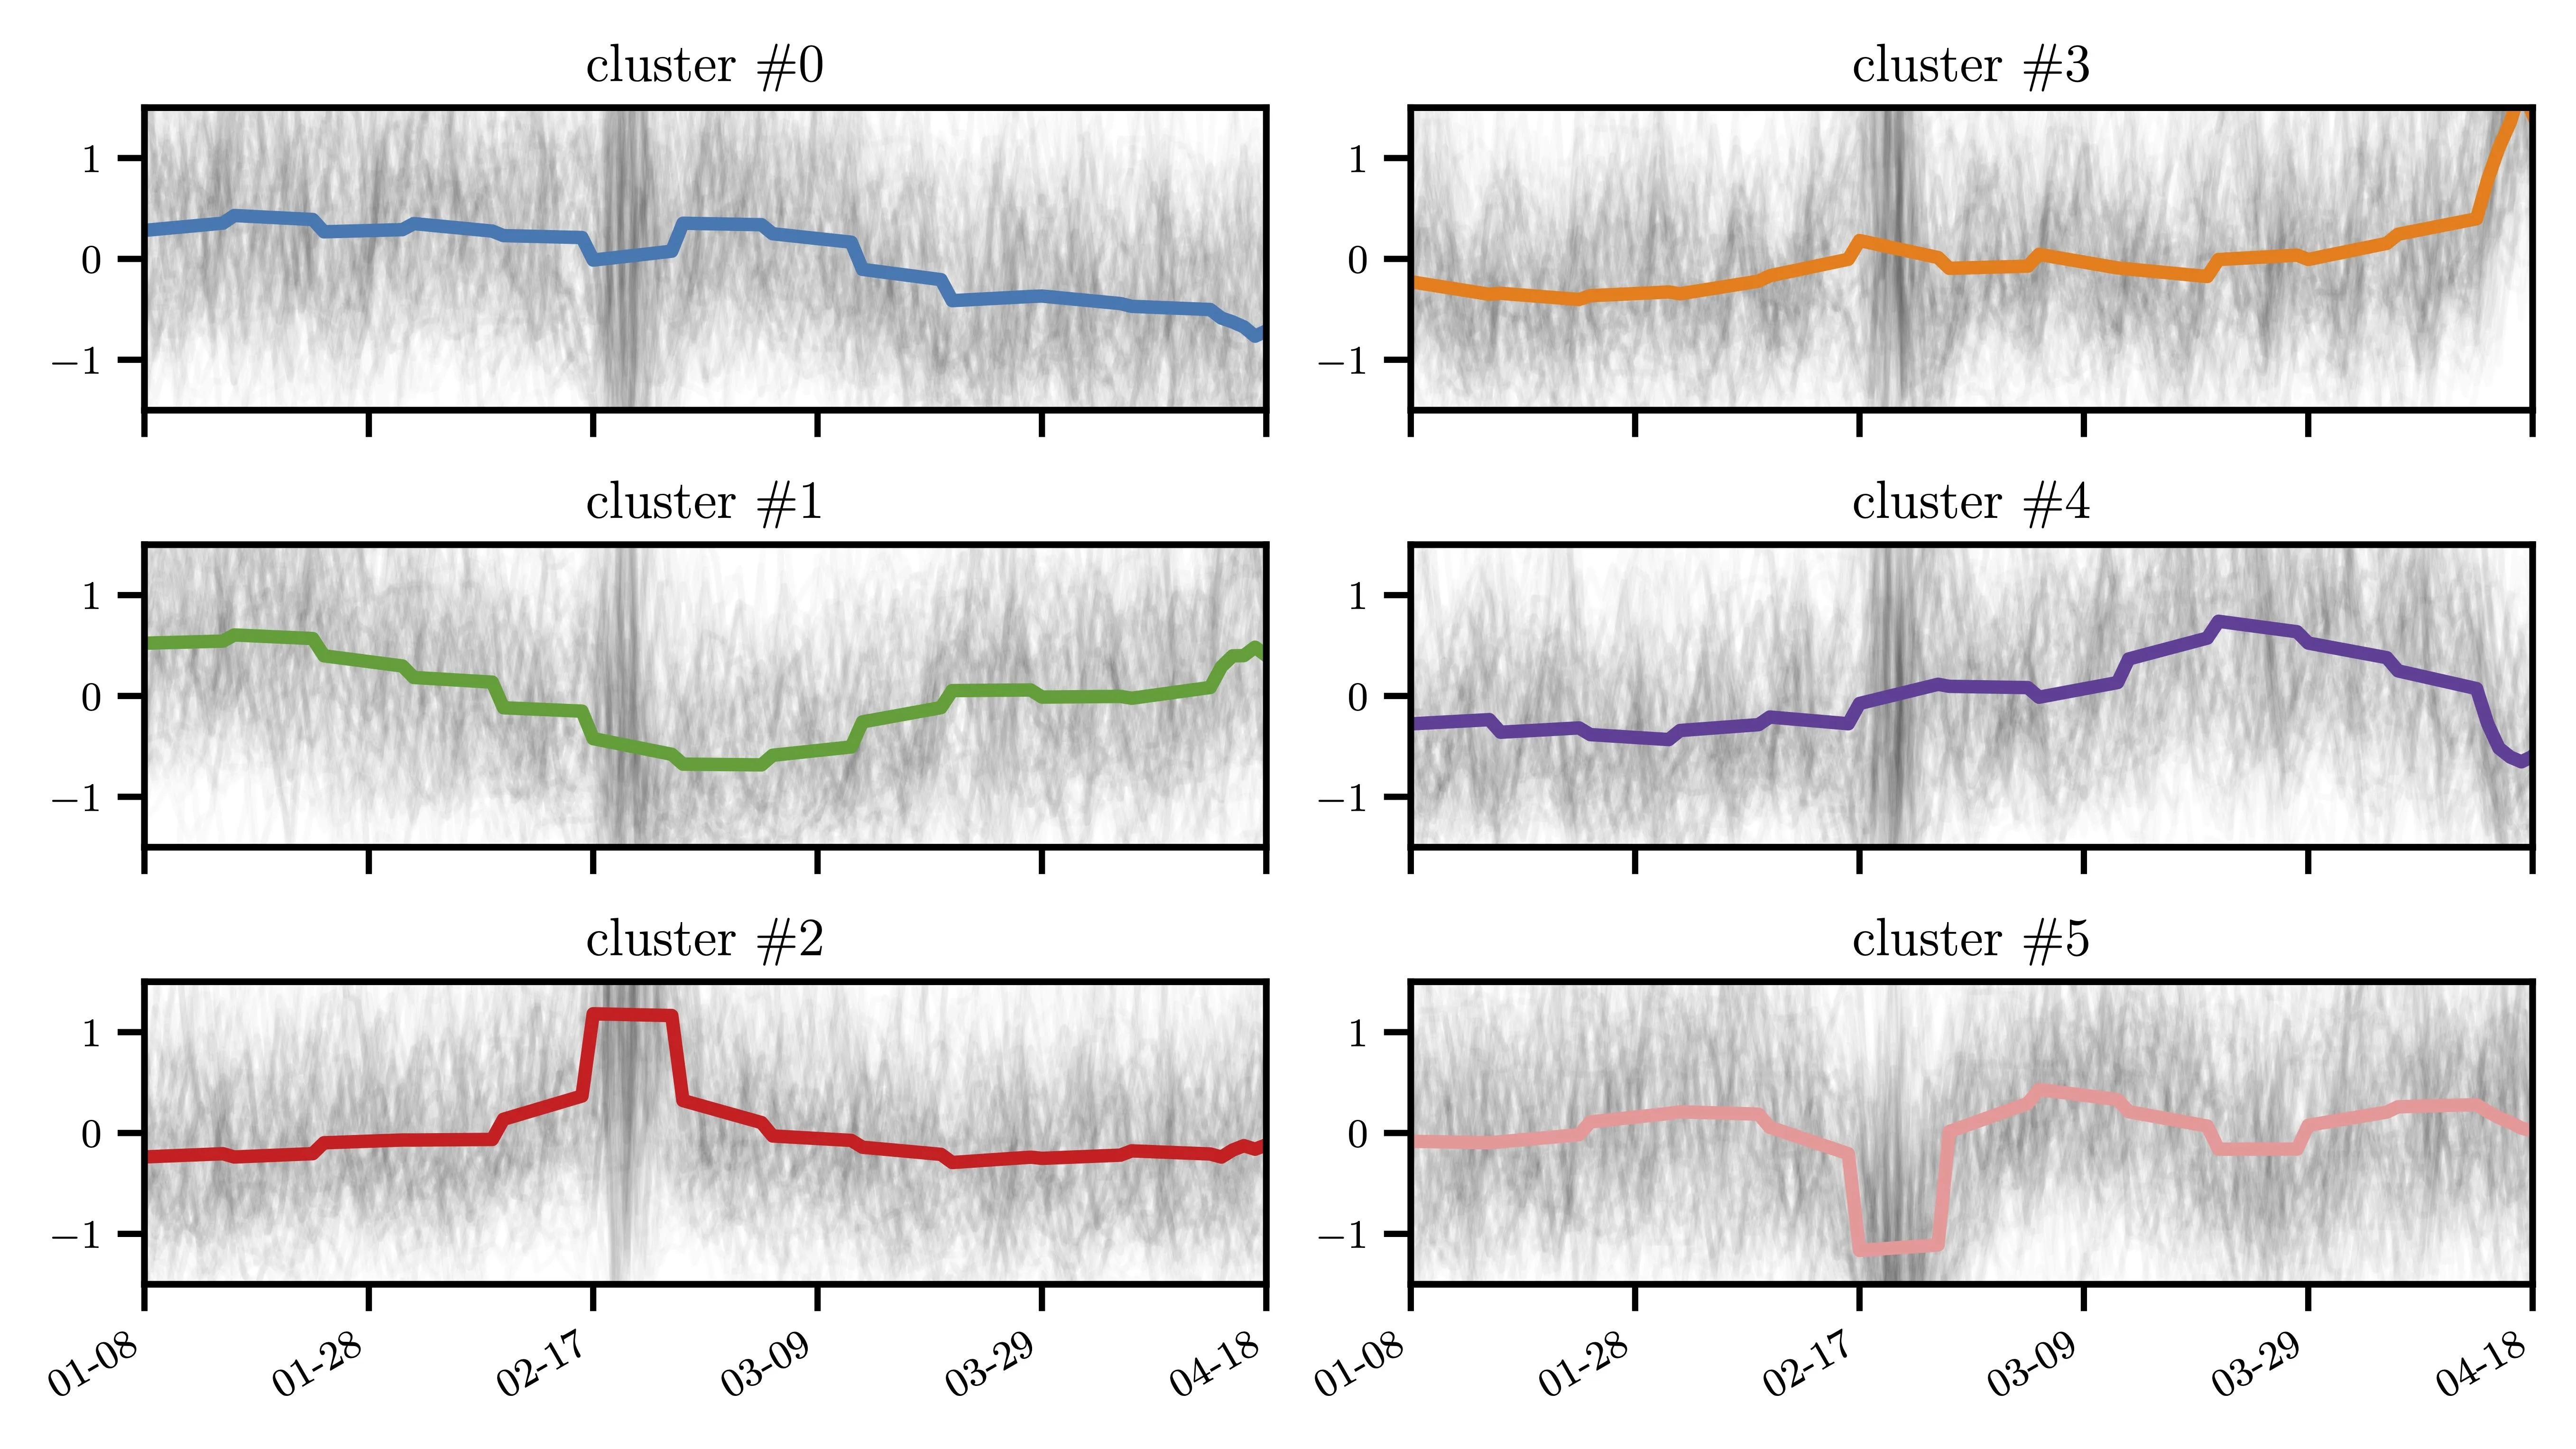
In February 2017, heavy rains hit Lima: rivers overflowed, roads flooded, and people were afraid to leave their homes. The city, like a person with a fever, fell out of its usual rhythm: shoppers went to stores less often and bought less.
Researchers decided to test exactly how a city weathers such a blow. They took data on 116.8 million bank transactions made by 1.5 million customers at 55,000 stores from June 2016 to May 2017. By comparing purchases in each neighborhood with the usual patterns for the whole country, they saw that during the floods the number of purchases dropped sharply. But within a few weeks, everything returned to normal.
However, not everyone was affected equally. In some neighborhoods, shopping activity declined, while in others it increased. People spent more on transportation, insurance, and health, and bought clothing less often. Grocery stores, pharmacies, hospitals, and gas stations became more important, while non-food stores lost customers. Large supermarkets, which usually form the core of the shopping network, temporarily shrank: their number dropped from 68 to 27.
This approach helps city services quickly identify which neighborhoods and businesses were hit hardest and direct aid there. It is like taking the city's pulse: if the rhythm is off, you need to act fast.
During the 2017 El Niño in Lima, sales of insurance policies surged: Peruvians, who insure only about three out of every hundred homes, rushed to protect their property after the first floods.