A City's Pulse After a Natural Disaster
Context
The 2017 El Niño in Peru killed over a hundred people, destroyed thousands of homes and roads, and triggered panic over supplies of lemons and garlic. Macroeconomic impacts of such disasters are well studied, but how individuals and small businesses react has remained unclear. This work fills that gap using detailed data on daily spending by Lima residents. It joins a line of research that uses mobile data, social media, and bank transactions to analyze societal responses to hurricanes, earthquakes, and other shocks, but stands out by focusing on the micro level of individual consumers and merchants.
Methods
The authors used an anonymized dataset of 116.8 million credit and debit card transactions made by roughly 1.5 million customers at 55,000 merchants from June 2016 to May 2017. To detect anomalies, they applied Kullback–Leibler divergence, comparing the distribution of purchases across 15 consumption categories in each district with the national average. To track changes in individual behavior, they built Markov chains of mobility, where states were the shops visited and transitions reflected the sequence of purchases. The significance of each merchant was assessed via PageRank on the transaction graph, and the resilience of the whole network was analyzed through the dynamics of its core and periphery.
Results
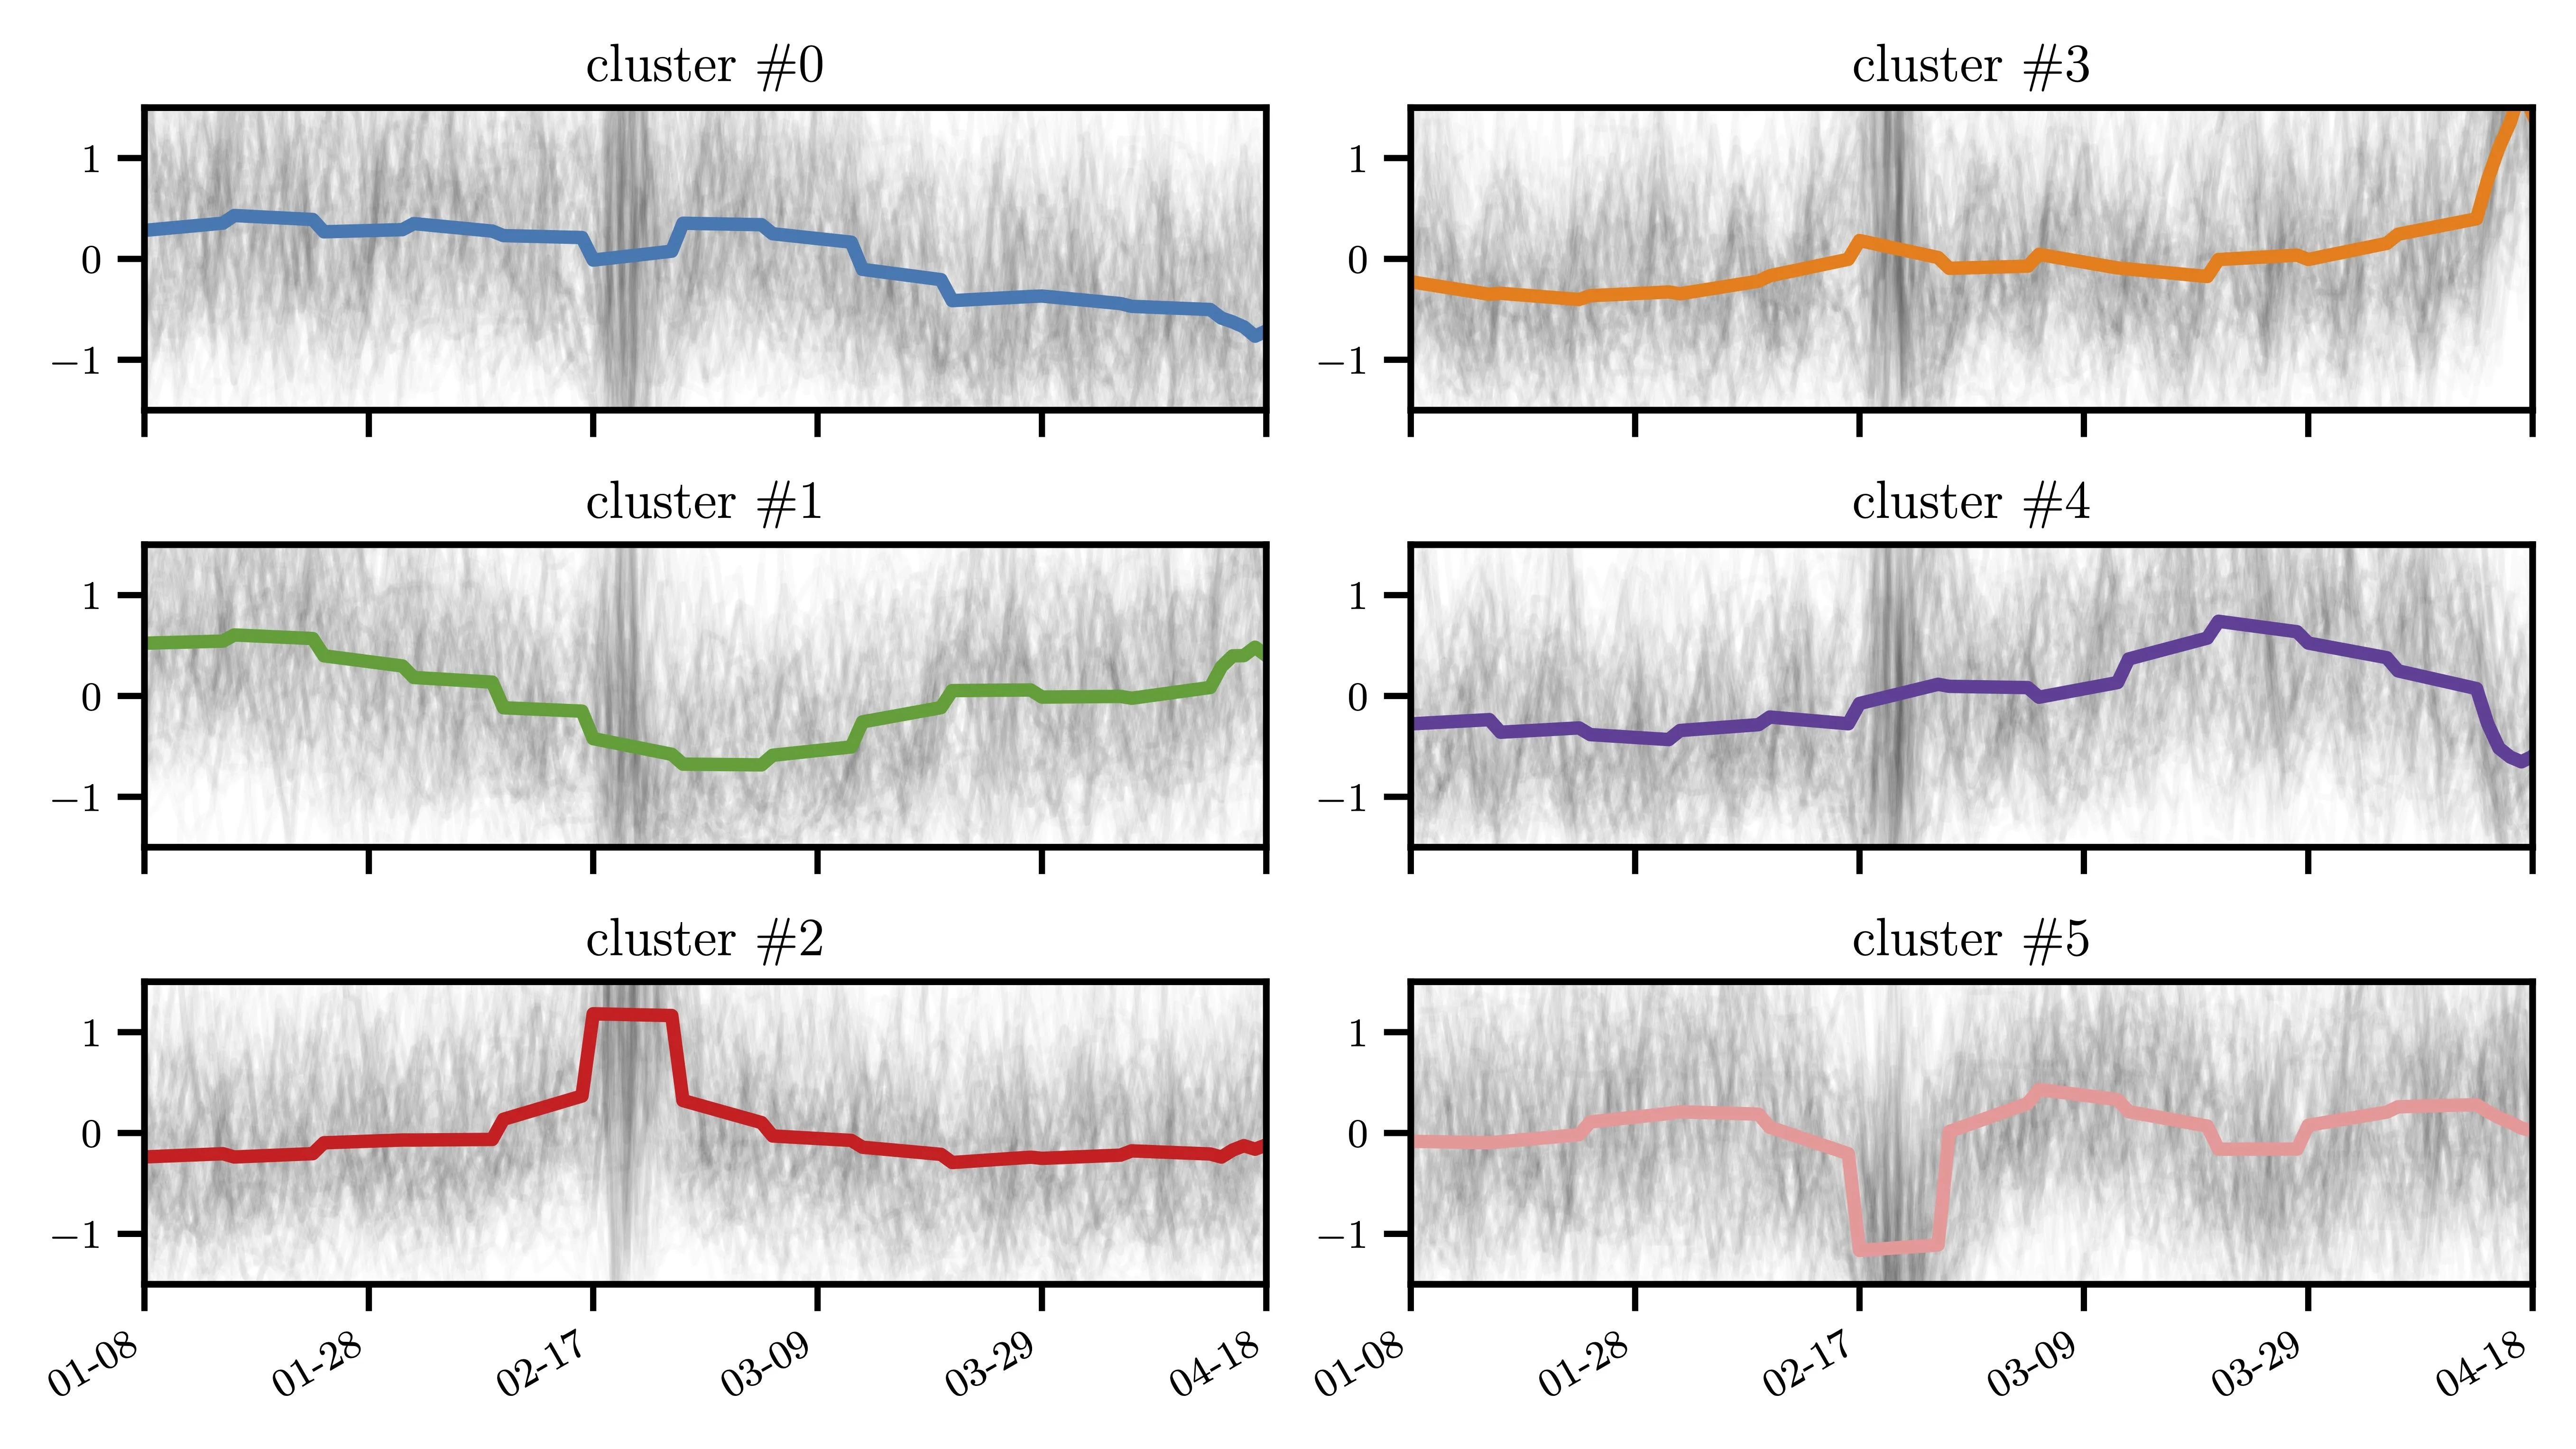
The analysis showed that during the February El Niño episode, the number and volume of transactions dropped sharply, while the decline in March was less pronounced. Kullback–Leibler divergence clearly identified both events against the background of normal weekly fluctuations. Lima's districts reacted differently: 20 districts saw a decrease in purchasing activity, 11 saw an increase, and the rest showed negligible changes. At the individual level, residents shifted toward public transport, insurance, and health products, while clothing purchases declined. PageRank analysis revealed that pharmacies, hospitals, gas stations, and grocery stores rose in the rankings, while non-food stores fell. The core of the transaction graph, consisting of large supermarkets, shrank from 68 to 27 nodes during the disaster, indicating a temporary contraction of economic activity.
Implications
The study demonstrates that digital traces of everyday purchases allow real-time tracking of societal responses to climate shocks. Unlike studies using aggregated macroeconomic data or social media, this approach reveals heterogeneity in response at the level of individual districts and merchants. The methodology can be transferred to other cities and disaster types, providing authorities with a tool for vulnerability assessment and aid planning. Furthermore, the observed contraction of the transactional network's core serves as a new indicator of economic stress.
Future development
In the future, such analysis could be automated and integrated into early warning systems to identify the most affected districts and business categories within the first hours after a disaster. Combining banking data with mobile operator data and satellite imagery could provide a more complete picture. Another direction is developing privacy-preserving methods that allow the use of detailed transaction data without risking customer deanonymization.
Impact
The results will be useful for city administrations, emergency response services, and insurance companies to assess the impact of natural disasters and allocate resources. They also provide an empirical basis for models of socio-economic resilience.
Next steps
The next step could be applying the proposed metrics to other climate events in different countries to test their universality. It is also important to study long-term changes in consumer behavior after infrastructure recovery.
Key open problems
The research directly addresses the problem of measuring the resilience of socio-economic systems to external shocks, which remains open due to the lack of detailed data on individual behavior. It also raises the question of balancing the utility of big data with citizen privacy, a key dilemma for the entire field of computational social science.
During the 2017 El Niño in Lima, sales of insurance policies surged: Peruvians, who insure only about three out of every hundred homes, rushed to protect their property after the first floods.
Key numbers
- transactions analyzed: 116.8 million
- customers in sample: 1.5 million
- merchants: 55,000
- network core size before disaster: 68 nodes
- network core size during disaster: 27 nodes