A City's Pulse After a Natural Disaster
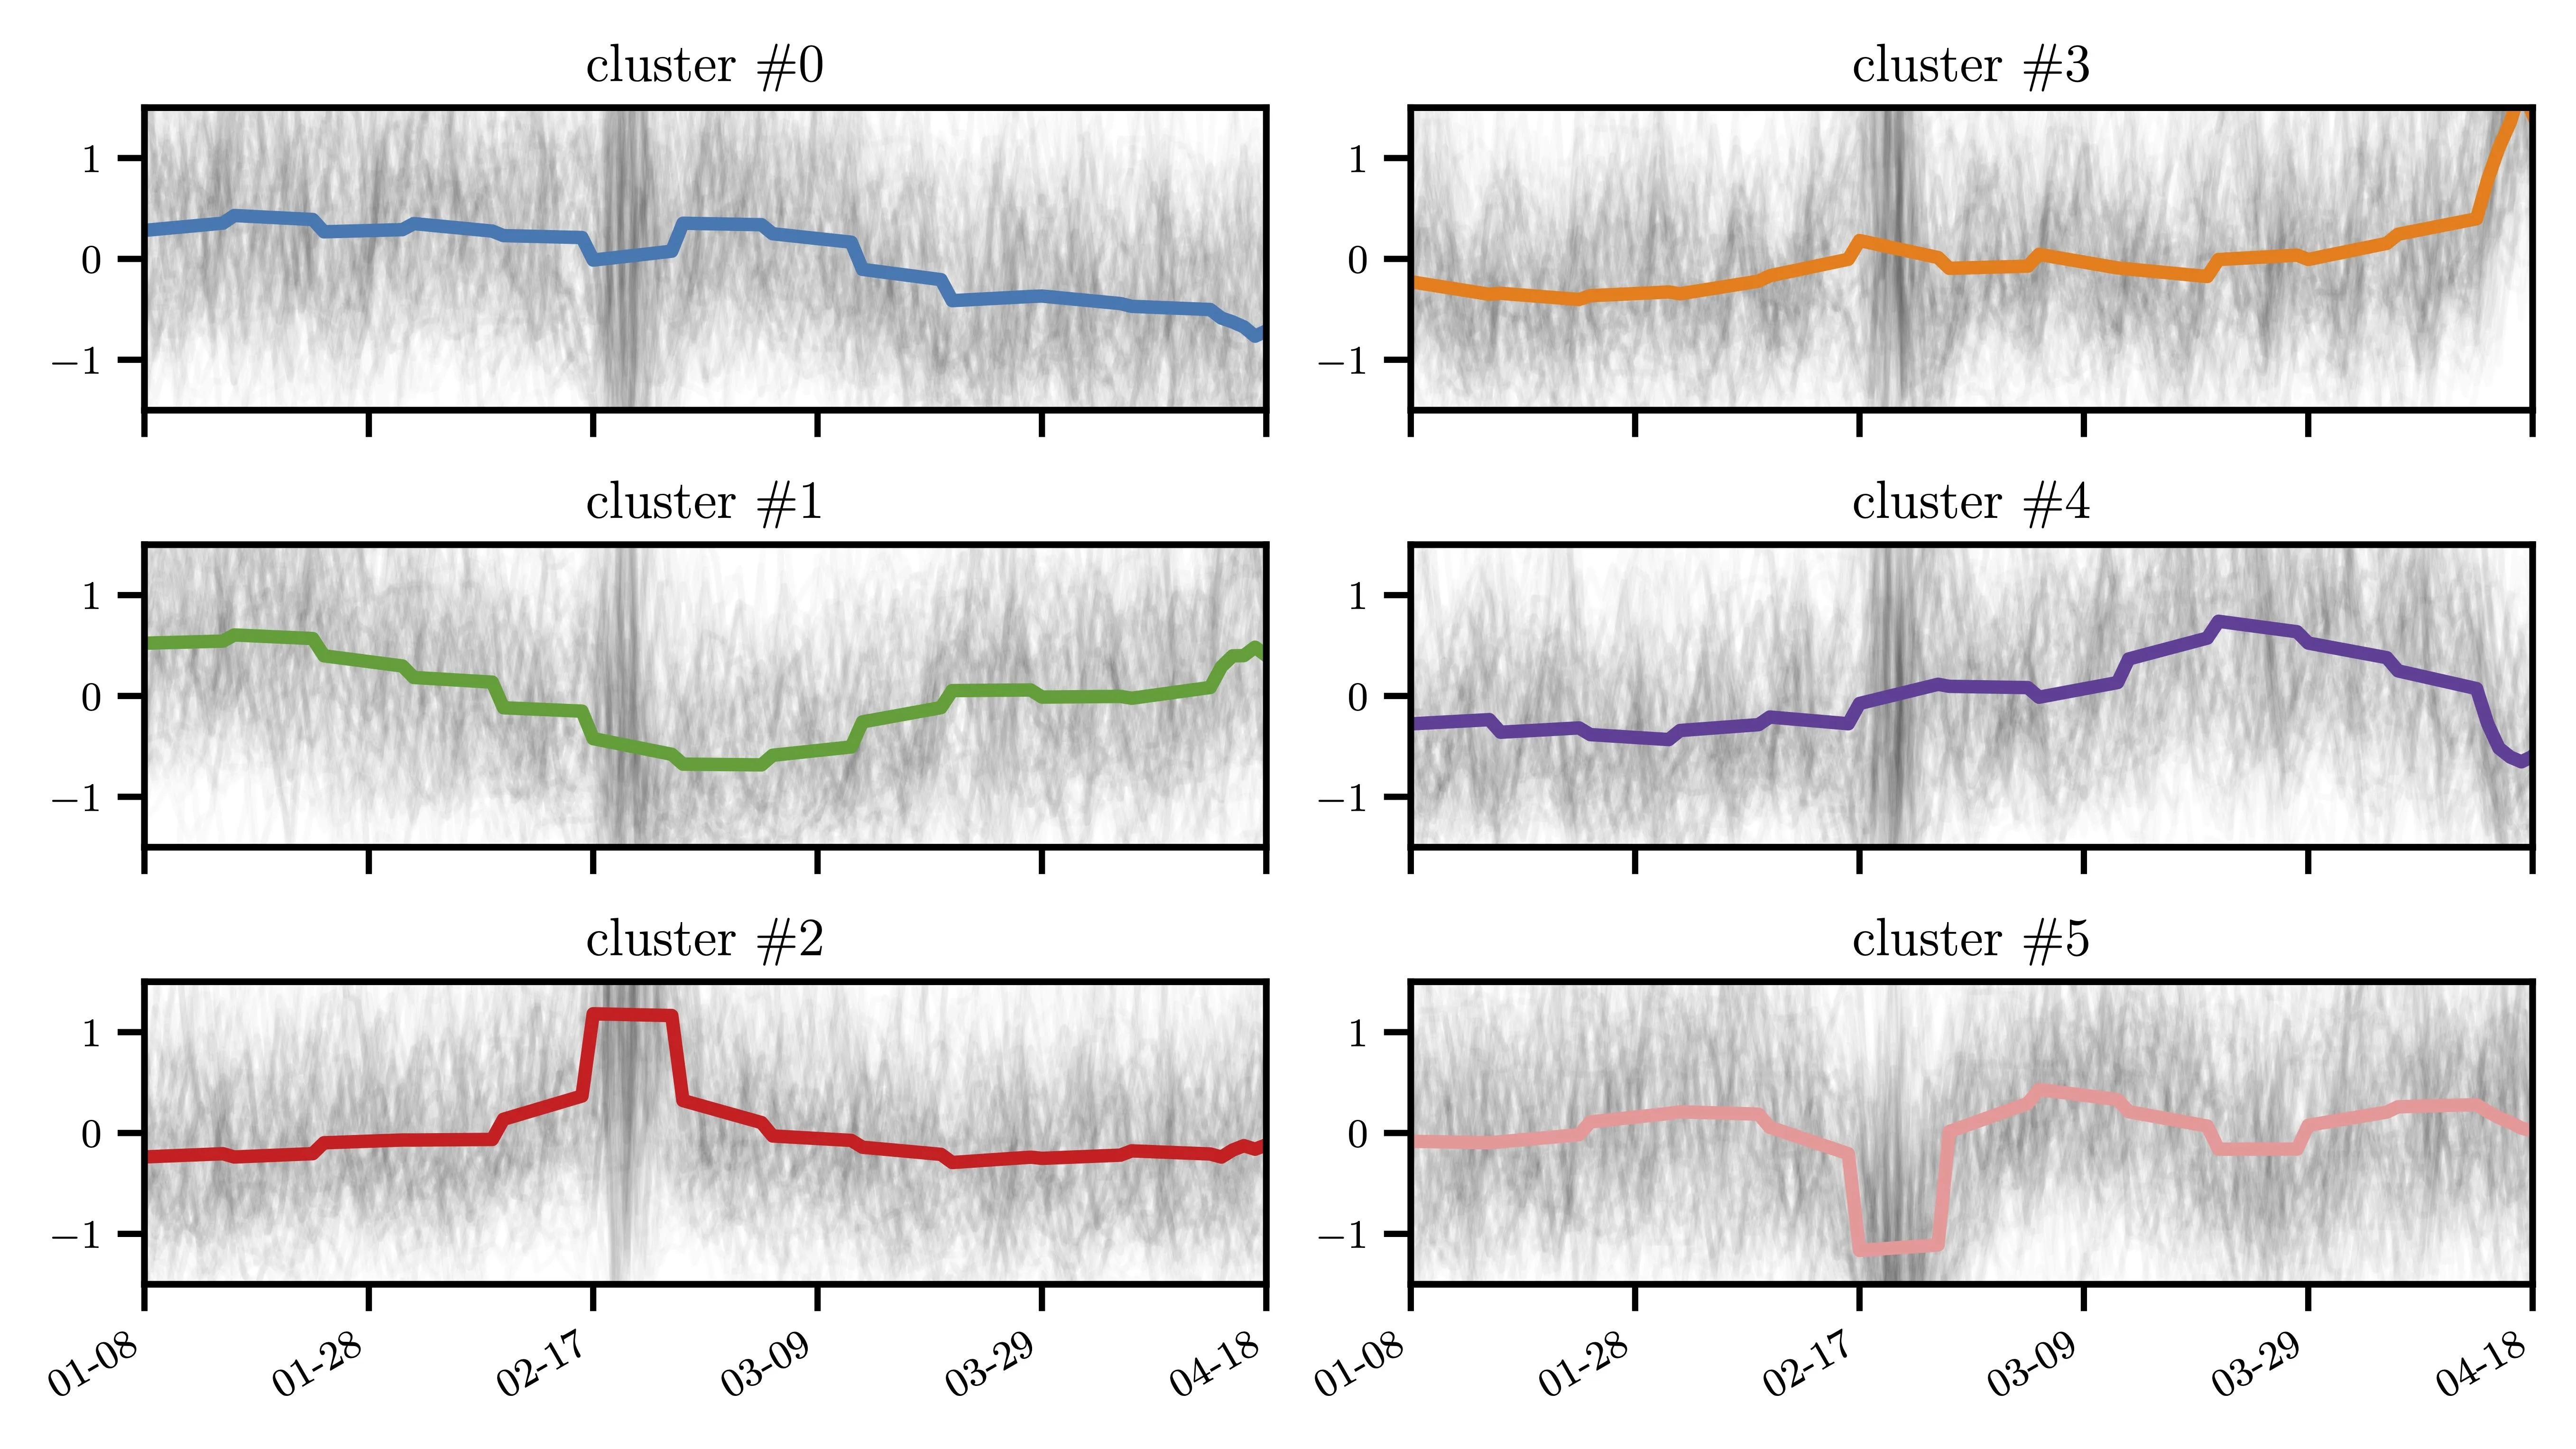
In February 2017, Lima, a city of over ten million people, was hit by El Niño: the warm current off Peru's coast brought torrential rains, floods, and landslides. More than a hundred people died, thousands of homes were destroyed, and roads turned into rivers. The city's economy, like a living organism, fell out of rhythm: shoppers visited stores less often, and their spending patterns shifted almost overnight.
To see how the city weathered the shock, scientists from Universidad del Pacífico and Telecom SudParis examined 116.8 million bank transactions made by 1.5 million customers at 55,000 merchants between June 2016 and May 2017. They compared the distribution of purchases across 15 categories in each district with the national average, using Kullback–Leibler divergence, a measure of how one probability distribution differs from another. This metric allowed them to flag anomalies against the usual weekly fluctuations.
The results showed that during the February episode, both the number and volume of transactions dropped sharply, while the decline in March was less pronounced. Lima's districts reacted differently: in 20 districts, purchasing activity fell; in 11, it rose; and in the rest, changes were minor. At the individual level, residents shifted toward public transport, insurance, and health products, while clothing purchases declined. A merchant importance analysis using PageRank, an algorithm that ranks nodes in a network based on their connections, showed that pharmacies, hospitals, gas stations, and grocery stores climbed in the rankings, while non-food stores fell. The core of the transaction graph, made up of large supermarkets, shrank from 68 to 27 nodes during the disaster, indicating a temporary contraction in economic activity.
The study demonstrates that digital traces of everyday purchases allow real-time monitoring of society's response to climate shocks. Unlike studies that rely on aggregated macroeconomic data or social media, this approach reveals the heterogeneity of responses at the level of individual districts and merchants. The methodology can be transferred to other cities and types of disasters, providing authorities with a tool for assessing vulnerability and planning aid. Furthermore, the observed contraction of the transaction network's core serves as a new indicator of economic stress.
A city, like a living organism, fell ill and recovered: a few weeks after the disaster, the rhythm of purchases returned to normal, but scars remained. Some districts and businesses bounced back faster, others slower, and those differences can now be seen in the flow of transactions.
During the 2017 El Niño in Lima, sales of insurance policies surged: Peruvians, who insure only about three out of every hundred homes, rushed to protect their property after the first floods.