How to Pick the Best El Niño Predictors ✛
Imagine a team of forty forecasters predicting El Niño, the warm current in the Pacific Ocean that affects weather worldwide. Each uses the same computer model but with slightly different initial conditions, so their forecasts differ a bit. Usually, all forty forecasts are averaged, assuming each is equally good. But that is not the case: some members are systematically more accurate than others.
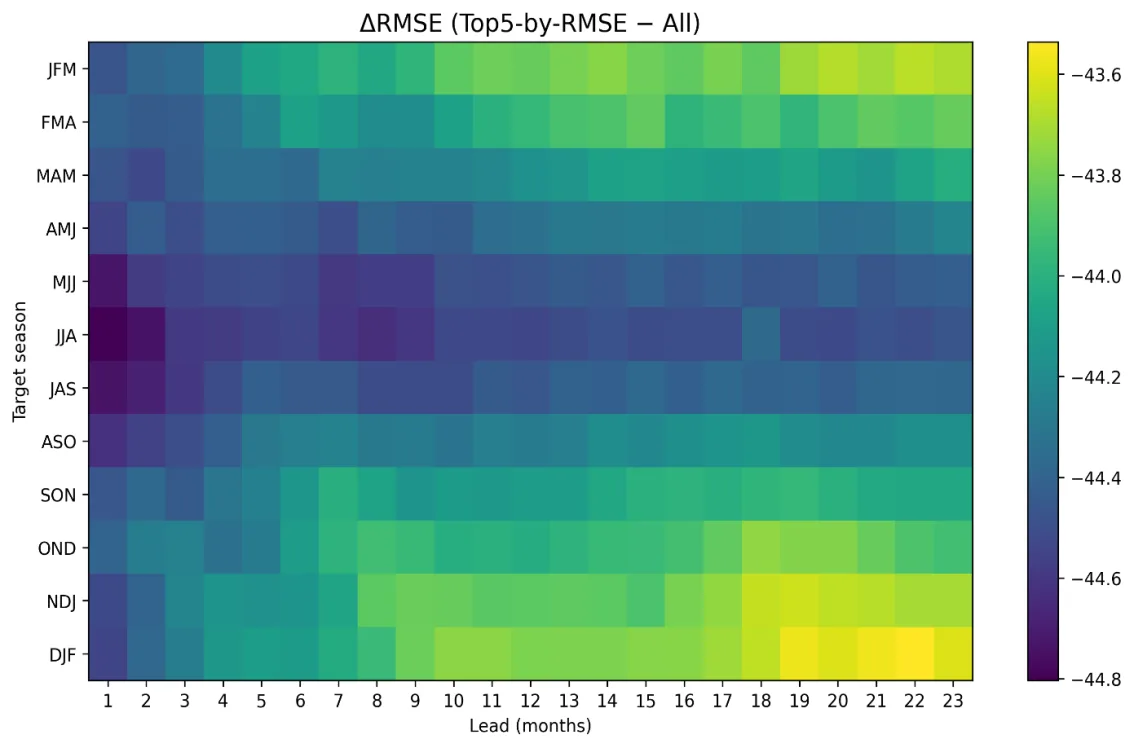
Scientists tested whether the best can be identified in advance. They took 40 forecasts of ocean temperature in the El Niño region and compared each with actual observations over 30 years. For each forecast lead time and season, they selected the five most accurate members based on two criteria: how closely the event's strength was predicted and how accurately its timing was guessed. They then combined these five forecasts with weights that depend on how often a member made it into the top five.
The result is striking: at short lead times the gain is modest, but by month 23 the correlation between forecast and reality increases by 0.43, that is, by 172%, while the error drops by 22.5%. The improvement is especially noticeable in transition seasons, when accurately predicting the onset and maturity of El Niño is crucial. Previously, it was unclear whether the spread in quality within an ensemble could be exploited. Now it is clear: in a set of 40 forecasts, there is always a subgroup of 5–10 members that predicts El Niño noticeably better than the average, and the gain grows with lead time.
This method can be embedded in operational weather forecasting systems as a cheap way to improve accuracy without changing the models. The next step is to learn to recognize strong members in real time, when future observations are not yet known. If that works, the team of forty forecasters will become even more accurate, because the coach will only put proven players on the field.
At a 23-month lead, the selected five members achieve a correlation 0.43 higher than the ensemble average, as if the forecast became almost one and a half times more 'in sync' with reality. And the computational cost does not increase by a single ruble.