In the context of physics and scientific modeling, 'data' refers to the raw measurements, observations, or numerical values that are collected from experiments, simulations, or natural phenomena. Data are the empirical foundation upon which theories are built and tested. They can take many forms: a series of numbers, images, spectra, or time series, and they are often noisy and incomplete. The process of turning raw data into meaningful scientific insight involves careful analysis, statistical inference, and comparison with theoretical predictions.
History
The systematic use of data in physics dates back to the scientific revolution, with figures like Galileo and Kepler using careful observations to formulate laws. The formalization of data analysis and error propagation was developed in the 19th century by mathematicians like Gauss and Legendre.
How it works
Data are generated by measuring some physical quantity, such as temperature, position, or energy. These measurements are subject to uncertainties and errors, which must be quantified. Scientists then use statistical methods to extract patterns, fit models, and test hypotheses. In modern physics, data often come from large-scale facilities like particle accelerators or telescopes, and are processed through complex pipelines to filter noise and identify signals. The key is that data are not just numbers; they are the interface between the physical world and our mathematical models.
In practice
Data analysis is used in every branch of physics, from analyzing particle collisions at the LHC to interpreting astronomical images from the James Webb Space Telescope, and in applied fields like medical imaging and climate modeling.
Fun fact
The word 'data' is the plural of the Latin 'datum,' meaning 'something given,' but in modern usage it is often treated as a singular mass noun.
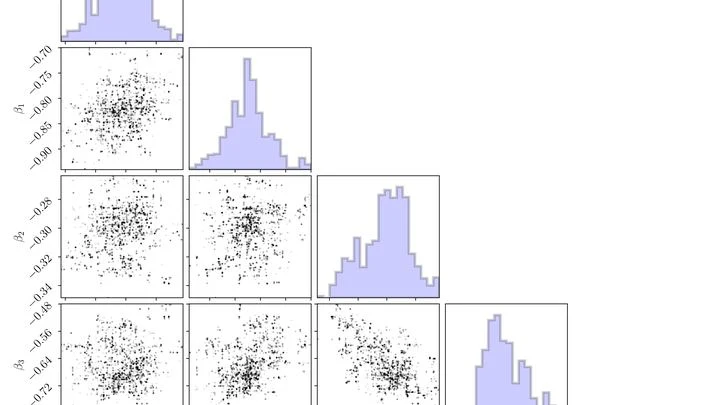
In the quantum world, a fact becomes objective when its value is imprinted on many independent fragments of the environment, like a notice posted on hundreds of bulletin boards across the city. Each copy alone adds no new information, but it changes the rules of the game for anyone trying to erase that information.
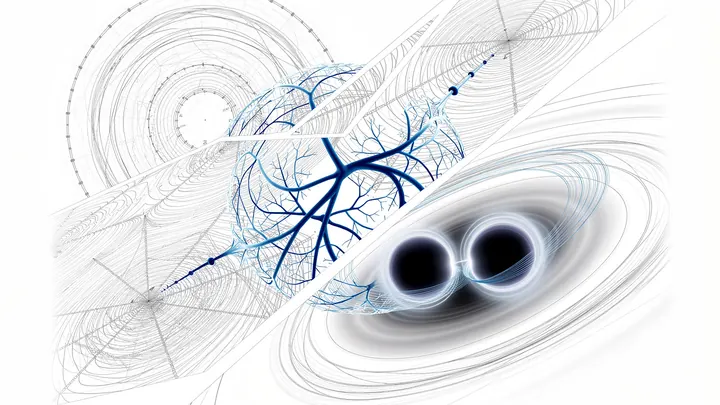
Isolating the signal from a single pair of supermassive black holes is like hearing a dancer's footsteps amid the roar of a hurricane. Somewhere in space, these monsters spin in a slow gravitational tango, distorting spacetime itself.
A candle flame in a draft dances: now it flares up, now it almost goes out. Quasars behave much the same way — supermassive black holes in the centers of distant galaxies, surrounded by a scorching disk of infalling matter. Only they flicker not over seconds, but over months and years.
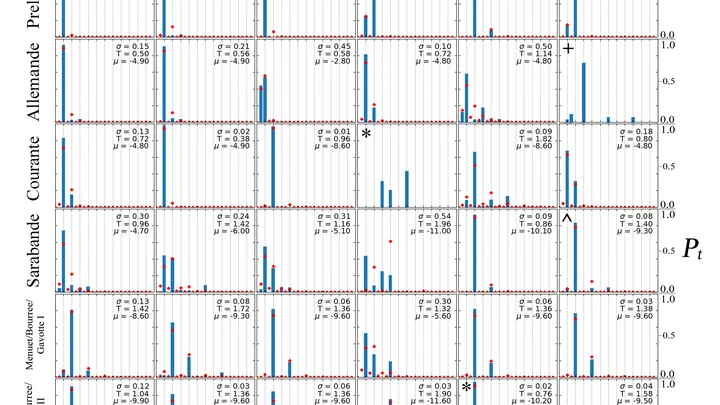
Music relies on repetition: we expect the beat to return, like a chorus coming back. But if you repeat the same thing for too long, it gets boring. The composer seems to walk a tightrope between the familiar and the unexpected.
Scientists translated this balance into the language of physics.
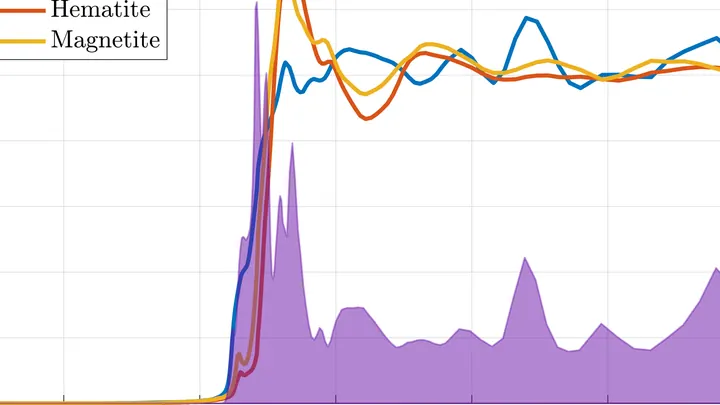
A chemical map of a sample is like a mosaic: each point has its own color, its own chemical composition. To assemble such a mosaic, a spectromicroscope scans the sample point by point, recording a spectrum at each location — a "fingerprint" of how the material absorbs or emits light.