The sample size is the number of individual observations, participants, or data points included in a study. It is a fundamental parameter in statistics because it directly influences the precision of estimates and the power of hypothesis tests. A larger sample size generally reduces sampling error, making results more reliable and more likely to reflect the true population effect, while a smaller sample size increases the risk of missing real effects or producing spurious ones.
History
The formal concept of sample size and its role in inference developed in the early 20th century, notably through the work of Ronald Fisher in the 1920s and 1930s, who established the framework for experimental design and hypothesis testing.
How it works
Statistical inference relies on the idea that a sample approximates the population from which it is drawn. The standard error of an estimate decreases as the square root of the sample size increases, so doubling the sample size roughly halves the margin of error. Power analysis, which determines the minimum sample size needed to detect an effect of a given size, balances the desired significance level, effect size, and statistical power.
In practice
Sample size calculations are routine in clinical trials, social science surveys, and quality control to ensure studies are neither underpowered nor wastefully large.
Fun fact
In some fields, the 'p-hacking' problem—where researchers collect data until results become significant—exploits the fact that increasing sample size can turn a non-significant result into a significant one, even when the true effect is zero.
An orchestra of thirty-six instruments plays almost in unison. The conductor tries to pick out which voice is carrying the melody, but the sounds blur together, and each successive bar only adds doubt.
A lone fish sees a shadow overhead. Should it flee? If it's just a leaf, it wastes energy and gives away its position to a predator. If it's a heron, hesitation is fatal. That's the eternal trade-off of the solitary individual: quick reactions mean many false alarms, while caution means risking being eaten.
In a school, it's different.
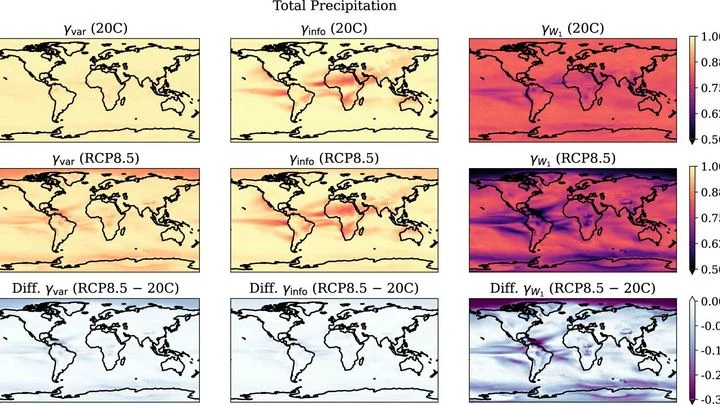
In winter, one part of town gets three times as much snow as the neighborhood next door. One year is a scorcher, the next is a cold snap. That's the whims of weather. But over decades, a different, slow shift emerges: winters, on average, get milder. Telling the two apart is the central challenge for climate scientists.
A perfume bottle is not just glass with liquid. It is a snapshot of its time, a frozen melody of fragrant notes. From 1900 to 2024, tens of thousands of such 'melodies' have accumulated, and now they can be studied as a single organism.
Usually, the complexity of systems, from satellite motions to heart rhythms, is assessed with averaged entropy (a measure of unpredictability, as understood by Boltzmann). But that's like evaluating the ocean only by wave height: the average figure hides the full richness of underwater currents.
Ordinary models assume that infection is like a steady flow of water that washes over everyone equally. In reality, the stream from a sick person fluctuates: right after infection it barely trickles, then turns into a raging downpour, and later subsides. The chance of catching the virus depends on the strength of this flow at the moment of contact.
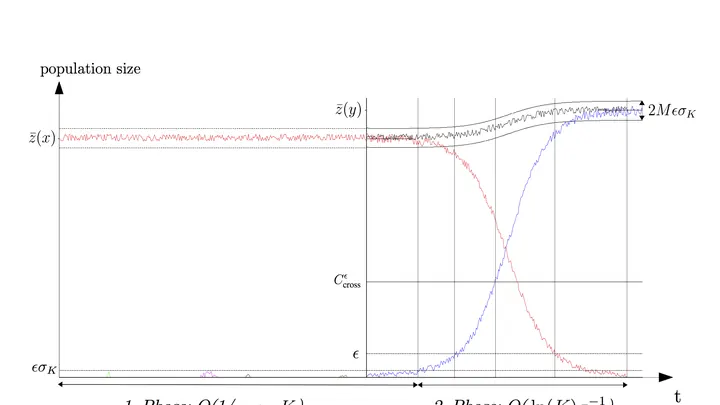
Evolution flows like water. In a wide river, changes are smooth and slow, while a mountain stream churns with every stone. Population size and mutation rate set the channel: broad and calm, or narrow and rapid-filled.
Imagine a ball in an unfamiliar hall: two guests start from opposite corners. Their movements are not a smooth waltz but chaotic improvisation in search of rare treasures. Contrary to intuition, the outcome hinges not on tempo but on the geometry of the floor.
The 120 residents of Montelago are not people but digital characters. Each, besides a name and biography, has three hidden coordinates: trust in municipal authorities, assessment of source credibility, perceived adequacy of information. These numbers are known to the creators but not to the system itself.
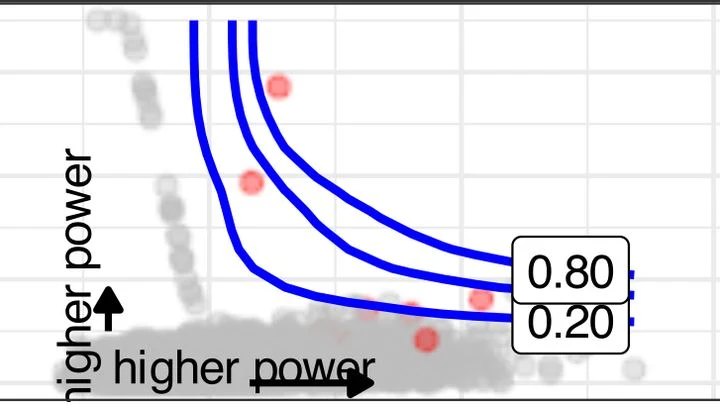
When you're planning a renovation, you don't buy paint by eye: you measure the wall area. In science, deciding how many samples to collect is a similar guess, but the stakes are higher. Skimp on samples, and your study becomes a lottery: you might miss a real effect, or you might mistake noise for a discovery. Overshoot, and you're wasting tubes, months, and, in animal experiments, lives.
In 1948, engineer Claude Shannon laid the foundations of information theory. The Nyquist–Shannon theorem gave the first answer: to avoid losing a signal, you need at least twice as many measurements as the fastest feature in the signal. In 2006, the method of compressed sensing relaxed this requirement.
Spread a handful of coins on the table. Each coin is a possible outcome: heads, tails, or something else. If we know how chaotic this set is (its entropy), which combinations of probabilities will we encounter more often? It turns out the answer depends on how much chaos we allow.
Tiny magnets on a lattice, the classic Ising model, are usually described by how neighbors influence each other. But what happens when the system is closely watched? Each measurement of a coupling energy is like a gaze that forces the magnets to 'decide' their state.
Your hand rests on the table, and two short vibrations arrive at your wrist — one after the other. You need to say which is stronger. The task seems simple, but the answer depends on which vibration came first. If the first is weak and the second is strong, the difference feels larger than when they are swapped.
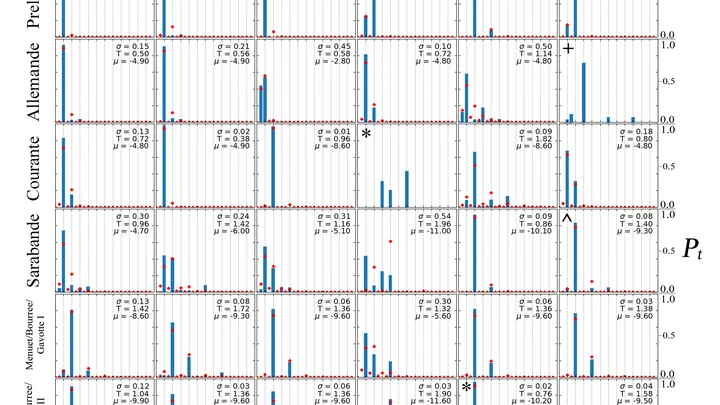
Music relies on repetition: we expect the beat to return, like a chorus coming back. But if you repeat the same thing for too long, it gets boring. The composer seems to walk a tightrope between the familiar and the unexpected.
Scientists translated this balance into the language of physics.
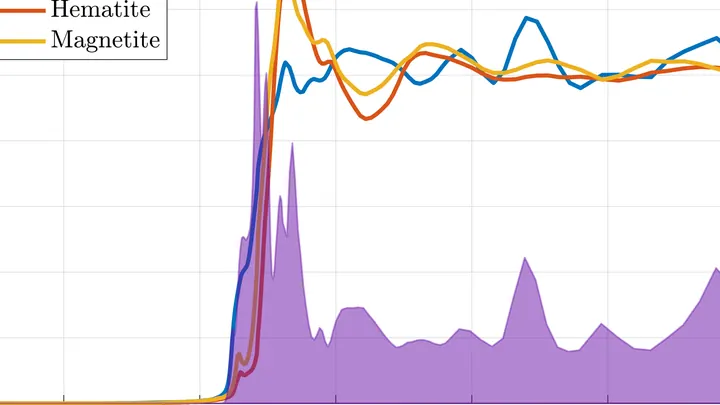
A chemical map of a sample is like a mosaic: each point has its own color, its own chemical composition. To assemble such a mosaic, a spectromicroscope scans the sample point by point, recording a spectrum at each location — a "fingerprint" of how the material absorbs or emits light.
A chemist searching for a new drug is like a cook without a recipe: they have a list of desired properties but millions of possible ingredients. Each trial is costly and time-consuming, so you need to experiment wisely.
The new program SEISMO acts like a chef who tastes the dish after every step and immediately decides what to add next.
Genetic diagnostics is like comparing two photos taken with different cameras. If one camera slightly shifts the colors, the image will show "defects" that don't exist in reality.
Imagine an interpreter who gets distracted by every rustle in the hall. The more rustles, the more errors in the translation, even though the meaning of the speech hasn't changed. The same happens with data: if measurements are unevenly spaced, standard analytical tools start "hearing" changes that never occurred in the underlying process.