Spectral analysis is a method for studying materials or astronomical objects by decomposing their emitted or reflected light into constituent wavelengths.
10 related articles · 6 formulas · 6 who worked here
Spectral analysis is a universal key. It doesn’t require touching the object; it’s enough to capture its emission. For example, light from a distant galaxy passing through a gas cloud loses very specific colors—they are absorbed by atoms. Such an absorption spectrum resembles a barcode: each dark line corresponds to a particular element. From the shift of these lines, one can even measure how fast the object is moving toward or away from us (the Doppler effect, a change in frequency due to motion). And in the radio range, spectral analysis ‘listens’ to molecular clouds, finding complex organic molecules.
History
The origins of spectral analysis lie in 17th-century optics (Newton decomposed light with a prism). In 1802, Wollaston noticed dark lines in the solar spectrum. From 1814 to 1823, Joseph von Fraunhofer catalogued them, not knowing the cause. The decisive step was taken by Gustav Kirchhoff and Robert Bunsen in 1859, who proved that each line is produced by a specific chemical element. Thus, the chemical analysis of radiation was born. Later, Johannes Rydberg (1890) derived a formula for hydrogen lines, and quantum mechanics explained spectra based on electron transitions.
How it works
Atoms absorb or emit photons of precisely defined energies equal to the difference between the energy levels of electrons. A transition from one level to another corresponds to a spectral line at frequency ν = ΔE/h. Spectra are classified into line spectra of atoms, band spectra of molecules (rotational and vibrational transitions), and continuous spectra of hot dense bodies (thermal radiation). For analysis, dispersive instruments (prism, diffraction grating), interferometers (high resolution), and photodetectors are used. Key characteristics: line position (wavelength), intensity, width, and line shape (Doppler and Lorentz broadening). The methods are applied across the entire electromagnetic spectrum, from radio to gamma rays.
In practice
Astronomers use a star’s spectrum to learn what elements it is composed of. In medicine, tissue spectra help distinguish healthy cells from cancerous ones.
Fun fact
The spectrum is the only way to know the chemistry of distant objects: no space probe has ever visited the Sun, but we know for certain that it consists mainly of hydrogen and helium, thanks to spectral lines.
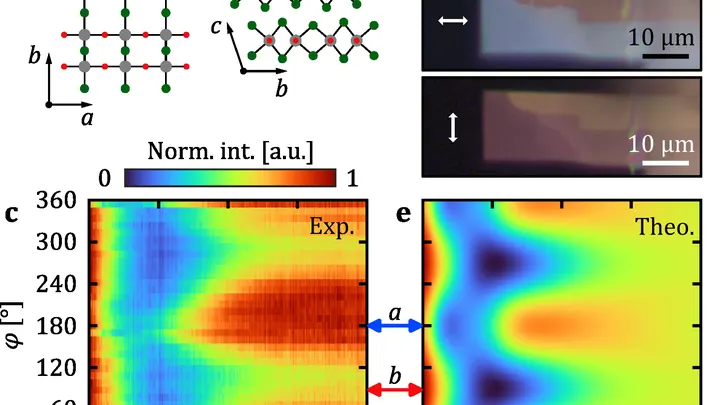
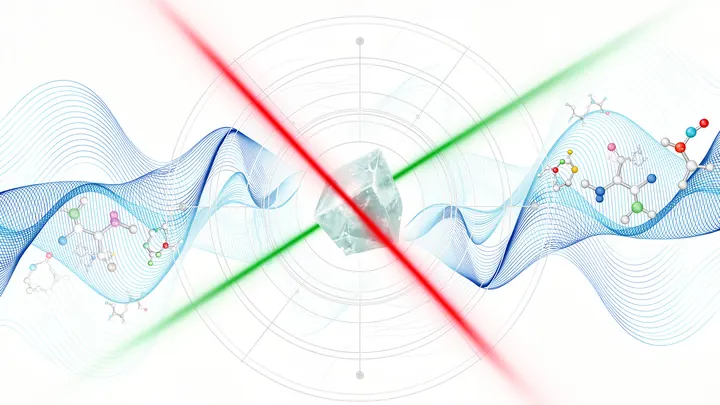
Light born when a fast electron enters a material is usually assumed to be the same in all directions. But in crystals where optical properties depend on direction, that's not the case. Run your hand over velvet: one way it's smooth and shiny, the other — dark and rough. Similarly, a crystal responds differently to light depending on how it's oriented.
A telescope stares at a star for many nights in a row. Somewhere in the stream of light hides a tiny dip in brightness — an Earth-sized planet briefly blocking part of the star. Such a dip lasts a few hours and repeats once a year or less. Catching it is like hearing a single quiet click in a noisy hall.
Light passing through a glass of murky water dims — some of it is absorbed. That's how many liquid-analysis instruments work: they measure how much light was lost and infer the composition from that. But if the liquid is heterogeneous, like soup with chunks, a single number isn't enough: you need to know where exactly more absorption happened.
The instrument shines an infrared beam at a sample, and molecules respond with their own absorption pattern, like bells of different tones. This pattern, the spectrum, holds information about the chemical composition. But to read it, a specialist usually consults a library of reference records, which is slow and not always possible.
The orchestra plays, but the conductor hears only a general hum. Each instrument plays its own part, but you can't tell where the flute is and where the double bass is. You need a spectrum analyzer — a device that breaks down sound by frequency.
A flashlight beam cuts through fog. The denser the fog, the more the light scatters and the later it reaches your eye. A similar principle works with fast radio bursts — mysterious, super-powerful pulses from distant galaxies. As their radio waves travel through space, they interact with free electrons — particles stripped from atoms.
14 seconds. That’s all it takes for a new code to weave the full spectrum of a star, from ultraviolet to near-infrared. This spectrum is not just a rainbow but a detailed tapestry of thousands of dark absorption lines, each left by a specific atom in the star's atmosphere.
An artist makes a quick charcoal sketch, and the face in the portrait is already recognizable. Astrophysicists face a similar challenge: the spectrum of a star is its individual portrait, revealing temperature, composition, and gravity.
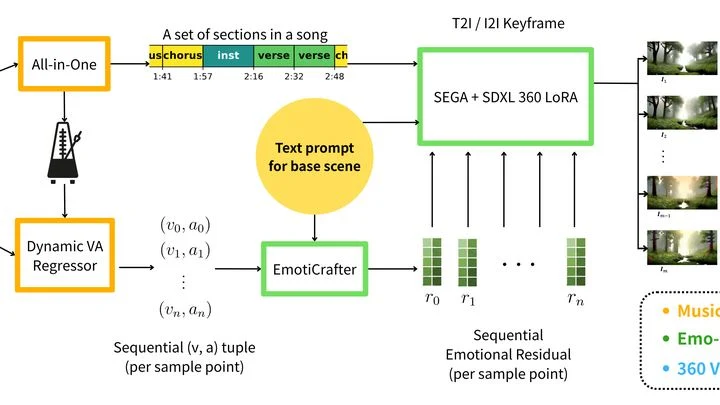
A conductor holds not a baton but a brush, and each stroke gives birth to color and form. New technology works the same way: it transforms a song's mood into a panoramic video that surrounds the listener.
First, the algorithm decomposes the track into emotions, similar to how light is analyzed by spectrum.
Conventional antennas for precise direction finding must work coherently: they capture not just volume, but also the wave's phase at a given moment. The slightest tuning mismatch, and the direction is lost. The new method relies solely on signal strength. It's like finding your way in fog, seeing only the brightness of lights, not their color.
A typical cardioid microphone, like an ear, hears best from the front, but its readings blur when sound comes from the side. The solution is to gather several such 'ears' into a sphere. You get a sound ball that picks up signals from all directions. By comparing measurements, the system breaks down errors into simple components — much like spectroscopy splits light.
Spectroscopy has always been a way to hear the unheard. Back in the 19th century, Johann Balmer deciphered the elegant lines of hydrogen — a simple numerical harmony that foreshadowed quantum theory.
Imagine a philharmonic orchestra playing, but the microphone picks up only a blended roar — a tutti where double basses, flutes, and timpani all merge. Physicists have grappled with a similar task for decades, staring at fields of density, temperature, or magnetic induction.
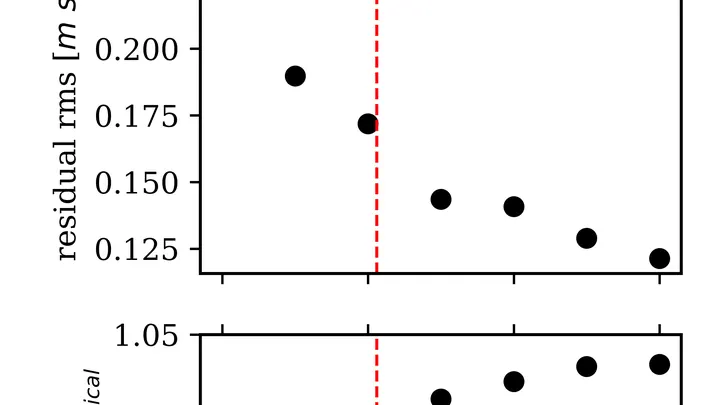
In a quiet observatory, a spectrograph catches the light of a distant star. The instrument spreads it into a rainbow — the spectrum. Lines in the spectrum shift slightly back and forth: an invisible planet is tugging the star. To spot this shift, astronomers compare the spectrum with a reference — a "portrait" of the star assembled from many observations.
Strike a tuning fork. The frequency is 440 Hz. That's the note A — the standard of sound.
In the world of numbers, there's a standard too. It's tuned not to sound, but to prime numbers. Though their distribution seems random, it obeys strict laws. All primes resonate together. There's just one value: λ∞ ≈ 0,674036.
For centuries, astronomers gazed at the night sky, catching the slightest changes in stellar brightness. These uneven sequences, light curves, are like musical staves: each star performs its own unique melody.
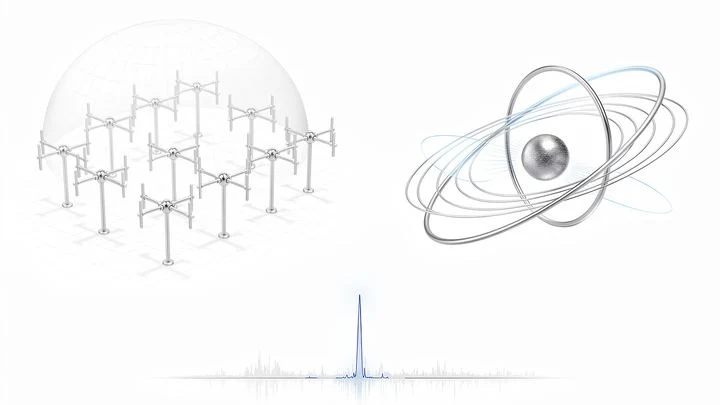
Listening to the cosmos requires patience and a finely tuned ear. Astronomers chose the most sensitive low-frequency instrument for this: the OVRO–LWA antenna array — 352 dipole antennas scattered across two and a half kilometers of California desert.
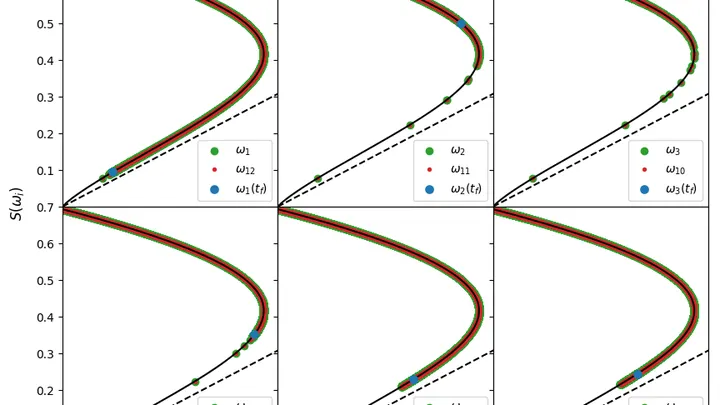
Neutrinos are nearly elusive particles that permeate everything around us. In a dense cloud, such as during a star explosion, they begin to collectively change their type, or 'flavor.' This process is like a crowd of people synchronously changing the color of their clothes, but not all at once — rather in waves.
A spectrum is like a photograph of a material's inner workings, taken with light. When a beam passes through or reflects off a sample, molecules leave characteristic dark bands, peaks, on that photograph. But if the image is overexposed or veiled in gray, making out details becomes nearly impossible.
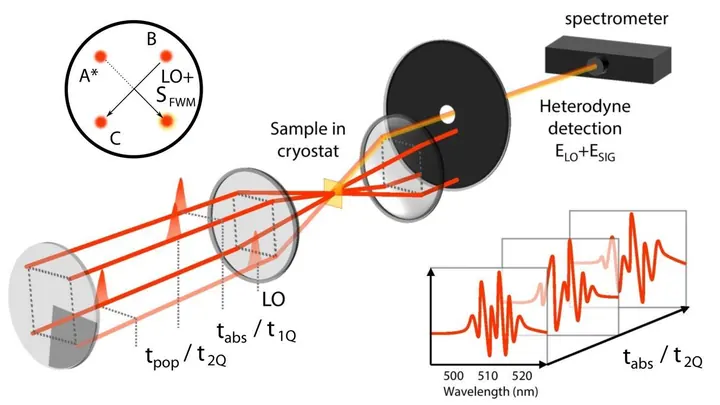
A squad of soldiers marches across a parade ground. As long as everyone keeps in step, the movement remains sharp and coordinated. But if someone falls out of line, the order is lost. In the microworld, electrons play the role of such a squad: when their oscillations are synchronized, the substance emits a narrow, sharp line.
An ordinary laser emits narrow lines, like a string that sounds only one note. For spectroscopy, this is inconvenient: if a substance absorbs light between the lines, you might miss it.
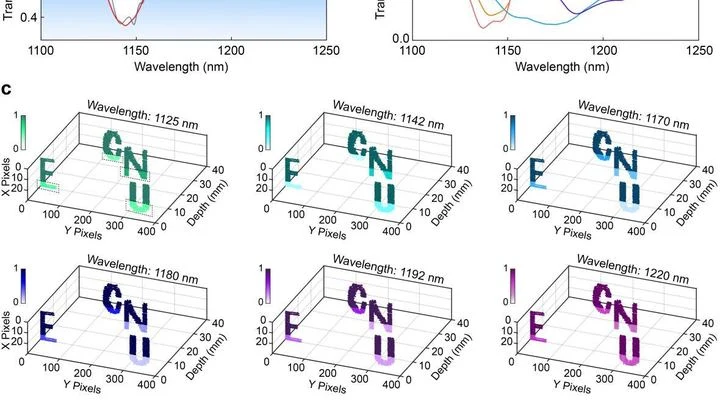
A conventional lidar is like an artist who paints a landscape but sees only gray shadows. It measures distances to each point accurately, but can't tell whether it's looking at rock, wood, or plastic. To learn the composition, you need a spectrometer — a separate device that works slowly and can't keep up with a fast scanner.
The new system takes a different approach.
A sheet of paper weighs almost nothing, but stack a hundred sheets and you get a noticeable pile. That's roughly what scientists did with a material that excels at converting one color of light into another, but only when it's just one atom thick. A single layer is like a single sheet: it works beautifully, but it's too thin to produce much light.
Hot massive stars are the kitchens of the Universe, where heavy elements are cooked up. They end their lives in supernova explosions. To understand their recipe, astronomers use spectroscopy — the analysis of the rainbow band of light passed through a prism. Previously, deciphering such a 'menu' took hours.
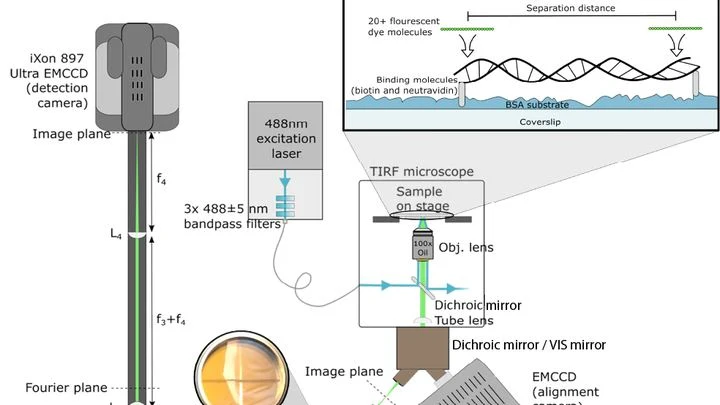
A conventional light microscope hits a fundamental limit: it cannot distinguish two points closer than 200 nanometers — roughly the thickness of a soap bubble divided by a hundred. To see deeper, scientists have made molecules in the sample blink or fade, but these tricks are slow and harmful to living cells.
A conventional radio receiver compares the incoming wave with a reference to extract information from it. Rubidium atoms can do this differently: they themselves act as both antenna and detector. But until now, they required an additional radio signal to set a reference point.
The new scheme does without it.
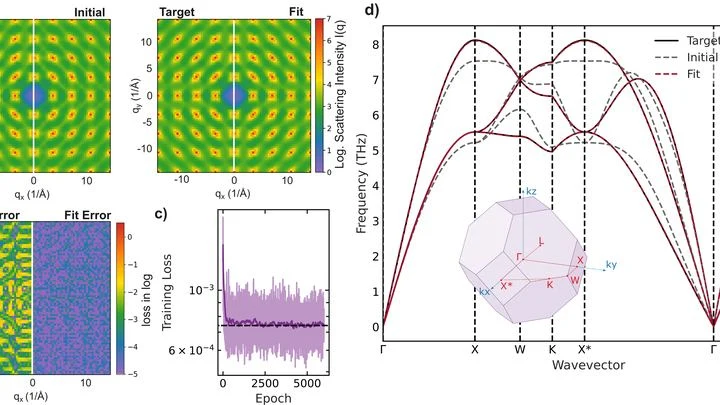
Heat a crystal, and its atoms start to jiggle like plucked strings. An X-ray beam passing through the crystal scatters off these vibrations, painting on the detector not only sharp spots but also faint, smeared patterns. These patterns are like fingerprints: from them, you can reconstruct how strongly atoms pull and push on each other.
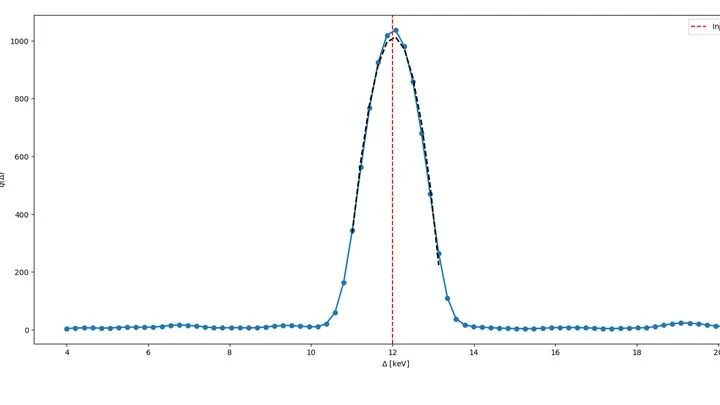
A gamma-ray spectrum looks like a picket fence: each line is the precise energy a nucleus released as a photon. But sometimes ghosts appear in that fence — faint lines shifted by the same amount from the main ones. Such a shift could mean that part of the energy went into creating a light particle we cannot yet see directly.
A barium titanate crystal is like a crowd where everyone holds a pointer. Normally, the pointers face in random directions, but when you apply an electric field, they all snap to point the same way. This ordered state is called ferroelectric: it stores information the way a compass needle stores direction.
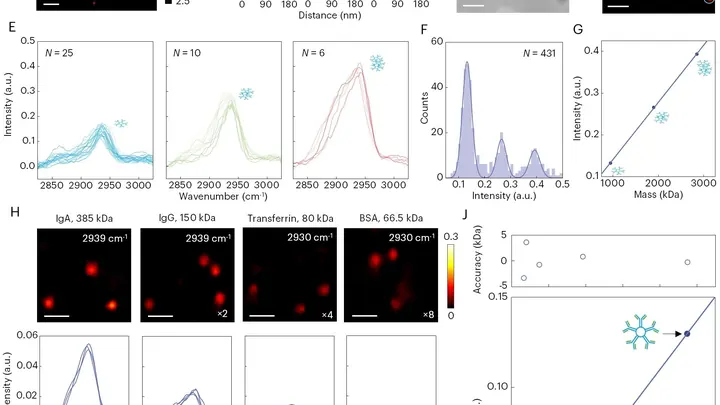
A protein in a cell is like a tightly coiled spring. Its shape determines what it does, but seeing that shape in a single molecule without disturbing it was nearly impossible. The new microscope works differently: it sends a short laser pulse that slightly heats the molecule.
Entangled photons are like two couriers marching in lockstep: their quantum states, particularly polarization, are synchronized so that measuring one instantly determines the state of the other, even at a distance. In a material, this synchronization gets disrupted.
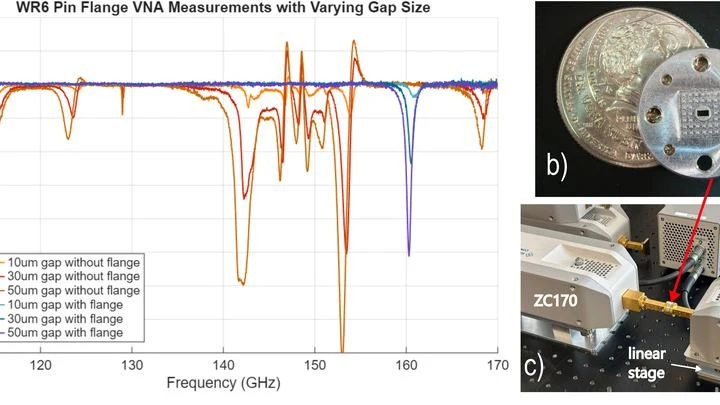
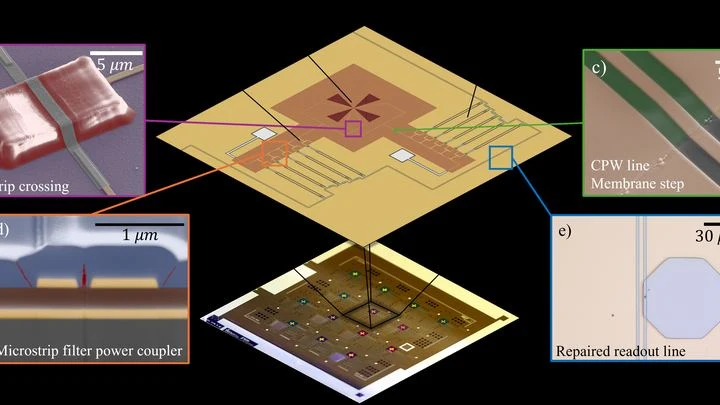
Tuning a radio to your favorite station is a search for the right frequency amid the noise. The new device does the same, but for waves about three millimeters long. Such waves come from distant galaxies and possibly from dark matter particles. The device is a pattern of superconducting niobium traces on a silicon wafer.
Strike a tuning fork, and it rings with a single pure note. But if the fork is trembling and people are chattering nearby, the sound won't be perfect. Same with molecules: each one absorbs light of a specific color, but due to its own vibrations and the jostling of neighbors, that color gets smeared out.
The authors of the paper figured out how to show this to students without complex formulas.
Light that has traveled to us for nearly 14 billion years is like an old photograph whose details emerge with careful processing. The cosmic microwave background (the afterglow of the Big Bang) holds the imprint of the universe's first moments, but its signal is faint and distorted.
There's a lot hidden underground: water, ore, sand, clay. To figure out what's there, you don't have to dig. Just run a weak alternating current through the ground and listen to how the rock 'responds' at different frequencies. This technique is called spectral induced polarization.
A laser beam hits a transparent crystal, and the crystal answers with a whole rainbow — from infrared to invisible ultraviolet. This isn't a trick with mirrors; it's the work of a nonlinear crystal, which can add light frequencies the way a musician plays not just the fundamental note on a string but also its overtones.
A star like the Sun doesn't just shine: it hums quietly. Inside, plasma churns, and these motions make the surface rise and fall rhythmically. Catching such a tremor from Earth is nearly impossible: it gets lost in the noise of the atmosphere and the instrument itself. That's why astronomers listen to stars from space, where it's quieter.
The gut talks to the doctor, but very quietly. Gurgles and rumbles last fractions of a second and easily get lost among the sounds of the lungs and heart. A stethoscope catches only a fraction, so the diagnosis depends on the experience and hearing of the individual doctor.
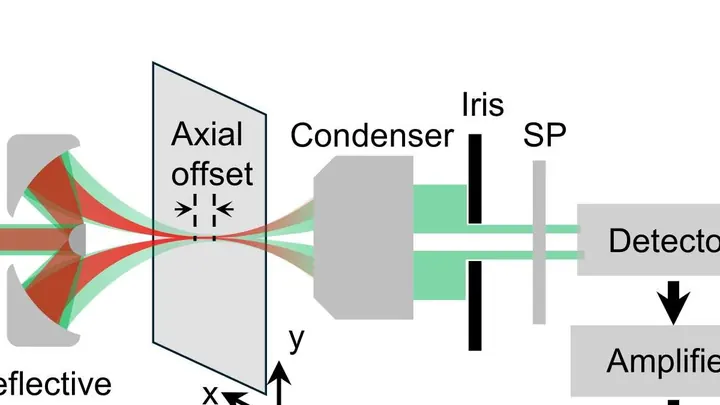
Light we can't see but feel as heat turns out to be the key to cellular life. A new type of microscope uses waves 2000–2500 nanometers long, three times longer than red light, and such waves barely scatter in tissue. Thanks to this, the device peers into a tumor spheroid like a flashlight through frosted glass, illuminating individual molecules.
The receiver doesn't catch radio waves but submillimeter light — the radiation emitted by cold clouds of gas and dust in distant galaxies. Inside, there's an array of tiny resonators, each tuned to its own frequency, like the strings of a grand piano tuned to notes.