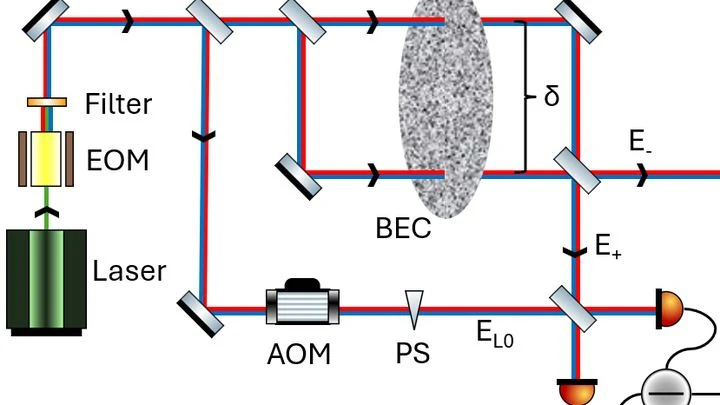
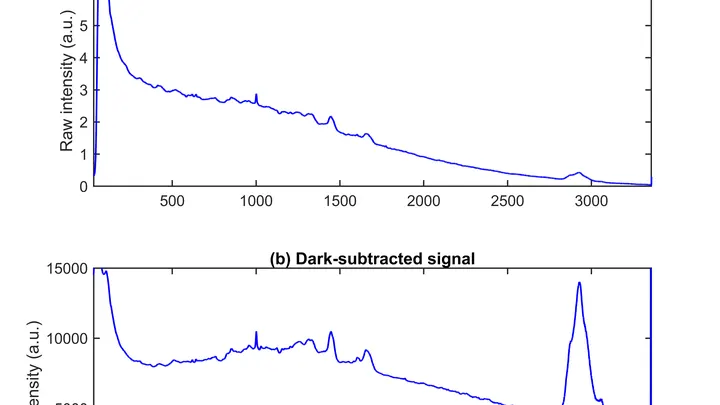
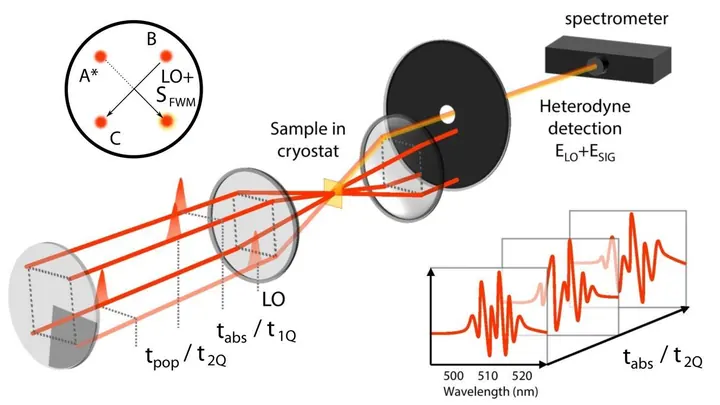
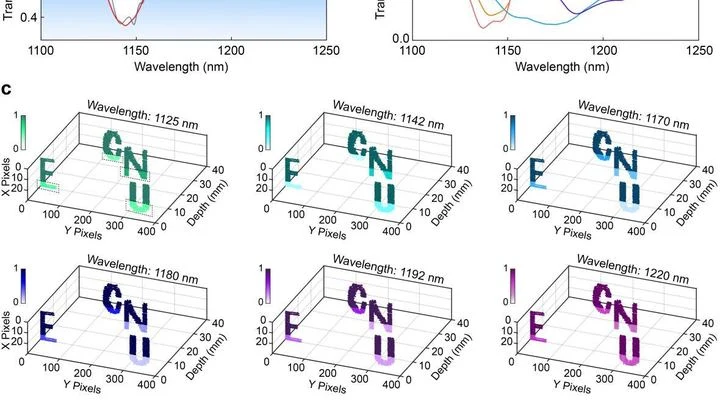
A spectrometer is an instrument for measuring the distribution of electromagnetic radiation by wavelength or frequency. Main components: an entrance slit, a dispersive element (prism or diffraction grating), focusing optics, and a detector (CCD array, photomultiplier). Spectrometers are distinguished by range: ultraviolet, visible, infrared, X-ray, etc. A spectrograph is an instrument that records the entire spectrum simultaneously. Key characteristics are spectral resolution and light throughput.
History
The history of the spectrometer began with the experiments of Isaac Newton in 1666, who decomposed sunlight with a prism. Newton introduced the term “spectrum,” calling the colored stripe a “ghost” (spectrum). In 1814, Joseph von Fraunhofer, replacing the prism with a diffraction grating of his own making, discovered dark lines in the solar spectrum (Fraunhofer lines) and measured their wavelengths. This laid the foundation for astrospectroscopy. In 1859, Gustav Kirchhoff and Robert Bunsen created the first spectroscope with a gas burner and prism, linking spectral lines to chemical elements. In the 20th century, the development of electronics led to photoelectric registration. Today, space observatories are equipped with spectrometers operating from X-ray to infrared ranges (for example, the STIS instrument on the Hubble telescope).
How it works
The principle of an optical spectrometer: the radiation under study passes through an entrance slit to a collimator, which forms a parallel beam. Then the beam hits a dispersing element—for example, a reflective diffraction grating with rules. According to the diffraction condition d(sin α ± sin β) = mλ, where d is the grating period, α and β are the angles of incidence and diffraction, m is the order, light of different wavelengths is deflected at different angles. Then a focusing mirror forms images of the slit in monochromatic light on the detector (CCD line or array). The signal intensity from each pixel is proportional to the photon flux of the corresponding wavelength. Calibration converts pixel number into wavelength. An alternative type is the Fourier spectrometer: it uses a Michelson interferometer, where the interferogram (intensity dependence on path difference) is measured, and the spectrum is recovered by Fourier transformation. The advantage is high resolution and light throughput.
In practice
In medicine, mass spectrometersdetect traces of drugs in blood, while optical spectrometers test water quality by identifying contaminants.
Fun fact
Every chemical element leaves a unique “fingerprint” in the spectrum—a set of bright lines. This is how astronomers determined that the Sun and other stars are composed mainly of hydrogen and helium.
An aluminum sphere the size of a large globe sits in a neutron beam and answers each hit with a precise note. Inside the sphere there is nothing but nitrogen and eleven tiny steel balls, each the size of a pinhead. When a neutron enters the sphere, it knocks a particle out of a nitrogen atom, and that jolt turns into an electrical signal.
A conductor raises the baton, and the orchestra produces not just sound but a complex score: each note sounds at its own moment, at its own pitch, with the right volume. Light can also be a score, if you control its spectrum and timing. Previously, this required bulky setups that could not be reconfigured after assembly.
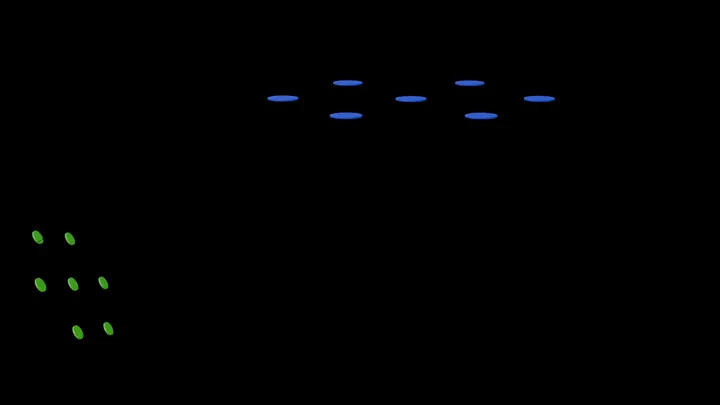
The two states of a strontium atom are like twins running down the same track, but one is slightly higher than the other. Usually, the light used to manipulate atoms pushes one twin harder and the other more weakly. Here, they chose a wavelength of 813 nanometers—'magic'—where both get the same kick.
Earth's magnetic field is not constant: it trembles from the solar wind, from distant thunderstorms, and from the subway running nearby. To notice these tremors, you need an instrument that doesn't tremble itself. Physicists have built such an instrument from ytterbium atoms cooled to nearly absolute zero.
The instrument shines an infrared beam at a sample, and molecules respond with their own absorption pattern, like bells of different tones. This pattern, the spectrum, holds information about the chemical composition. But to read it, a specialist usually consults a library of reference records, which is slow and not always possible.
If a smell seeps into a room through a slightly open door, you could stand in the middle and sniff. But the most accurate way to catch the moment the smell arrives is to stand right at the threshold. A cell behaves much the same way when it needs to measure the concentration of a substance around it.
The orchestra plays, but the conductor hears only a general hum. Each instrument plays its own part, but you can't tell where the flute is and where the double bass is. You need a spectrum analyzer — a device that breaks down sound by frequency.
The orchestra plays, but the conductor hears only a general hum. Each instrument plays its own part, but you can't tell where the flute is and where the double bass is. You need a spectrum analyzer — a device that breaks down sound by frequency.
When an orchestra of thousands of musicians plays in harmony, the credit goes not only to each player's talent but also to the invisible work of the conductor.
A night river is dotted with tiny sparks. This isn't plankton: it's functional pollen-sensors, millimeter-sized devices that swim on their own and measure the water's chemistry.
Each particle is a tiny lab. Inside, two reagents meet: one triggers a glow upon contact with a pollutant, and the second, a colored filter, blocks out interference.
Light waves are never perfectly smooth — they are constantly jittered by quantum ripples. These almost invisible nudges were studied by Nobel laureate Roy Glauber, who laid the foundations of quantum optics. Now physicists have learned to freeze these ripples.
Heat is all around us: from a car's exhaust pipe to the casing of a running laptop. Thermoelectric materials could turn that waste heat into electricity.
Diabetes is a constant reminder of needles. To check glycated hemoglobin (HbA1c — a blood protein that reflects average sugar over three months), you need regular blood draws from a vein. It's unpleasant, requires a lab, and takes time. And if you live far from a city, every test becomes a major expedition.
The new iGLU 5.0 device changes the game.
An ultra-sensitive microphone listens not to sound, but to the trembling of space itself. That's how gravitational wave detectors work — LIGO, Virgo, KAGRA.
Every quantum particle has spin — an intrinsic magnetic property, like a tiny arrow. In an experiment, a beam of such particles passing through a magnet splits in two, like a coin that lands either heads or tails. That’s exactly how particles like a hydrogen atom behave.
Physicists have proposed an experiment: a laser beam acts as a quantum detector and splits into two beam-ears. Each ear is directed through a tiny cloud of ultracold atoms — in this state, atoms merge into a single wave.
Light can be more than just a beam: it can be a precision ruler. If you take very short pulses, shorter than a fly's wingbeat, and fire them one after another, you get an optical comb: a set of colors spaced at exactly equal intervals, like the teeth of a comb. This rainbow lets you measure distances, time, and the composition of materials with unimaginable accuracy.
Ever since Paul Dirac theoretically predicted antimatter, physicists have been hunting for the tiniest differences between particles and their antiparticles.
A drop of blood from a vein falls under three beams, and each one drags its own clues into the light. The infrared beam makes molecules vibrate — from that trembling, you learn how much sugar and fat is in the sample. A green laser scatters off proteins and lipids, shifting color — revealing the remodeling of cell membranes.
A squad of soldiers marches across a parade ground. As long as everyone keeps in step, the movement remains sharp and coordinated. But if someone falls out of line, the order is lost. In the microworld, electrons play the role of such a squad: when their oscillations are synchronized, the substance emits a narrow, sharp line.
A substance's spectrum is its fingerprint. Usually, to record one, you place the sample in a strong magnetic field, like in an MRI scanner. But there is a way to do without a magnet altogether: detect the signal from atomic nuclei at zero field. Until now, this method suffered from poor sensitivity, and its complex spectra were hard to predict.
An ordinary laser emits narrow lines, like a string that sounds only one note. For spectroscopy, this is inconvenient: if a substance absorbs light between the lines, you might miss it.
A conventional lidar is like an artist who paints a landscape but sees only gray shadows. It measures distances to each point accurately, but can't tell whether it's looking at rock, wood, or plastic. To learn the composition, you need a spectrometer — a separate device that works slowly and can't keep up with a fast scanner.
The new system takes a different approach.
An X-ray beam is a stream of tiny packets of energy, photons. Ordinary detectors count them but don't distinguish shades: two photons with close energies look the same to them. The new device works like a sensitive thermometer: it catches each photon and measures how much it warms a thin film. From the warming, you can tell exactly how much energy the photon brought.
In giant accelerators, particles zip through detectors in billionths of a second, and telling one from another requires a stopwatch of incredible precision. The new µRWELL-PICOSEC detector acts as such a stopwatch: it captures the moment a particle passes with a precision of 48 picoseconds: that's 48 trillionths of a second.
Atoms in a beam travel at different speeds, like runners on a track. A regular laser pulse only pushes those moving at one speed, but the new one acts like a coach giving commands to the whole group at once. This approach involves more atoms in the measurement.
Hot massive stars are the kitchens of the Universe, where heavy elements are cooked up. They end their lives in supernova explosions. To understand their recipe, astronomers use spectroscopy — the analysis of the rainbow band of light passed through a prism. Previously, deciphering such a 'menu' took hours.
A conventional light microscope hits a fundamental limit: it cannot distinguish two points closer than 200 nanometers — roughly the thickness of a soap bubble divided by a hundred. To see deeper, scientists have made molecules in the sample blink or fade, but these tricks are slow and harmful to living cells.
A laser flash lasts a few femtoseconds — imagine a single instant stretched into a million parts. Such a flash mixes many colors, from red to violet. Instruments that measure the pulse shape often err: they see some colors well and others poorly, blurring the picture.
The authors propose a simple fix.
Tuning a radio to your favorite station is a search for the right frequency amid the noise. The new device does the same, but for waves about three millimeters long. Such waves come from distant galaxies and possibly from dark matter particles. The device is a pattern of superconducting niobium traces on a silicon wafer.
A flashlight beam in fog breaks into thousands of faint specks. Each speck is light that has bounced off countless water droplets before reaching your eye. To make sense of this mess, physicists construct a special table — the scattering matrix. It records how each incoming ray turns into a set of outgoing ones.
Light that has traveled to us for nearly 14 billion years is like an old photograph whose details emerge with careful processing. The cosmic microwave background (the afterglow of the Big Bang) holds the imprint of the universe's first moments, but its signal is faint and distorted.
The receiver doesn't catch radio waves but submillimeter light — the radiation emitted by cold clouds of gas and dust in distant galaxies. Inside, there's an array of tiny resonators, each tuned to its own frequency, like the strings of a grand piano tuned to notes.
A seismometer is the planet's ear. It picks up the faintest tremors in the ground and turns them into an electrical signal. But this ear isn't perfect: its sensitivity depends on temperature. In the cold and in the heat, the instrument hears slightly differently, and that introduces error into measurements.
A tiny needle glides over the surface like a finger over a page written in Braille. That's how a scanning tunneling microscope works: it feels the atomic landscape and turns bumps into a picture. But when you need to add a magnetic field, the design hits a wall.
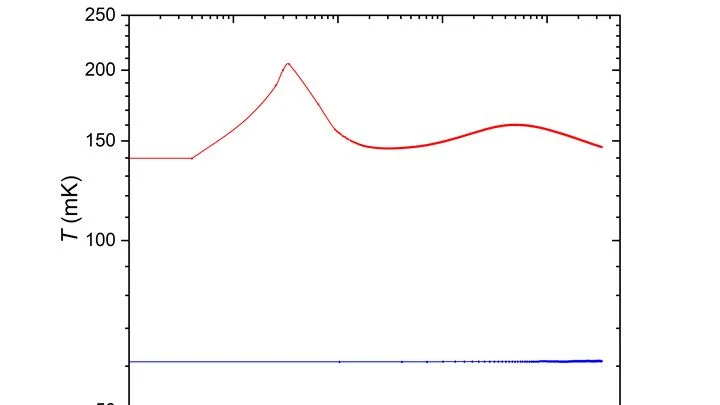
At 0.1 K, just three-tenths of a degree above absolute zero, matter stops following the usual rules. Helium becomes superfluid: it flows without friction, seeps through cracks, and behaves like one giant quantum liquid. Seeing what happens inside such cold is a challenge at the edge of possibility.
An X-ray image usually brings to mind a bulky machine in a hospital. But such a picture can be taken by a device the size of a palm, assembled from hobbyist electronics. The authors took a Raspberry Pi mini-computer, a 12.3-megapixel camera, and a screen that glows under X-rays.
The night sky is not all that dark. Even far from cities, it glows faintly — which hampers astronomers trying to catch weak flashes from distant cosmic rays.
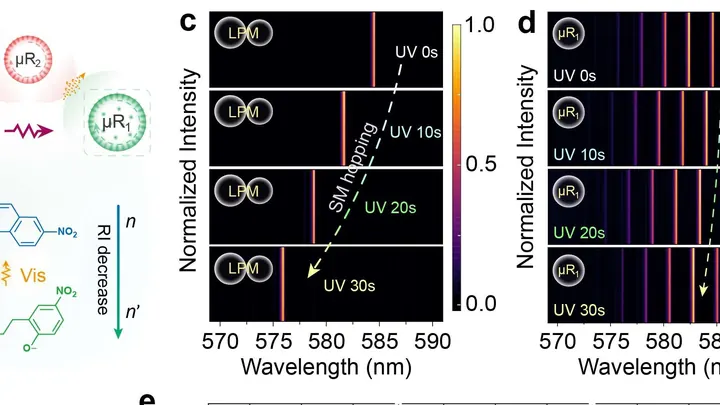
Two liquid droplets hanging side by side begin to sing in unison. One droplet is like a string tuned to a certain pitch, and together they form a laser that shines with a single, pure color. That's how a new type of sensor, a liquid photonic molecule, works.
The secret is that the droplets are slightly different in size.
An X-ray photon hits the detector like a pebble dropping into still water. The water is a thin film of aluminum and manganese, cooled to near absolute zero. The impact sends a heat wave rippling across the film, and by measuring its height, you can tell how much energy the photon carried.