Ozone Sings in Many Voices: How Climate Stratifies by Altitude
In the vast concert hall of the atmosphere, ozone plays a part that changes from tier to tier. Near the surface, its notes sound alarming, for there it is a pollutant that irritates lungs and leaves. At 25 kilometers up, the same gas becomes a protective shield that absorbs harsh ultraviolet radiation. Same chemical composition, but opposite roles, and a listener standing on the ground hears only a fraction of this symphony.
Scientists set out to separate this multi-voiced choir into individual parts, to understand who chimes in and when. To do so, they took daily records of ozone mixing ratios over 41 years, from 1979 to 2020, at 37 pressure levels from the ground to the upper stratosphere. Each point on the map became a singer, and its fluctuations over time, a note. Then they applied the eigenmicrostate method, which finds recurring patterns in the chaos on its own, without hints about what to look for. In this way, clear voices emerged from the noise.
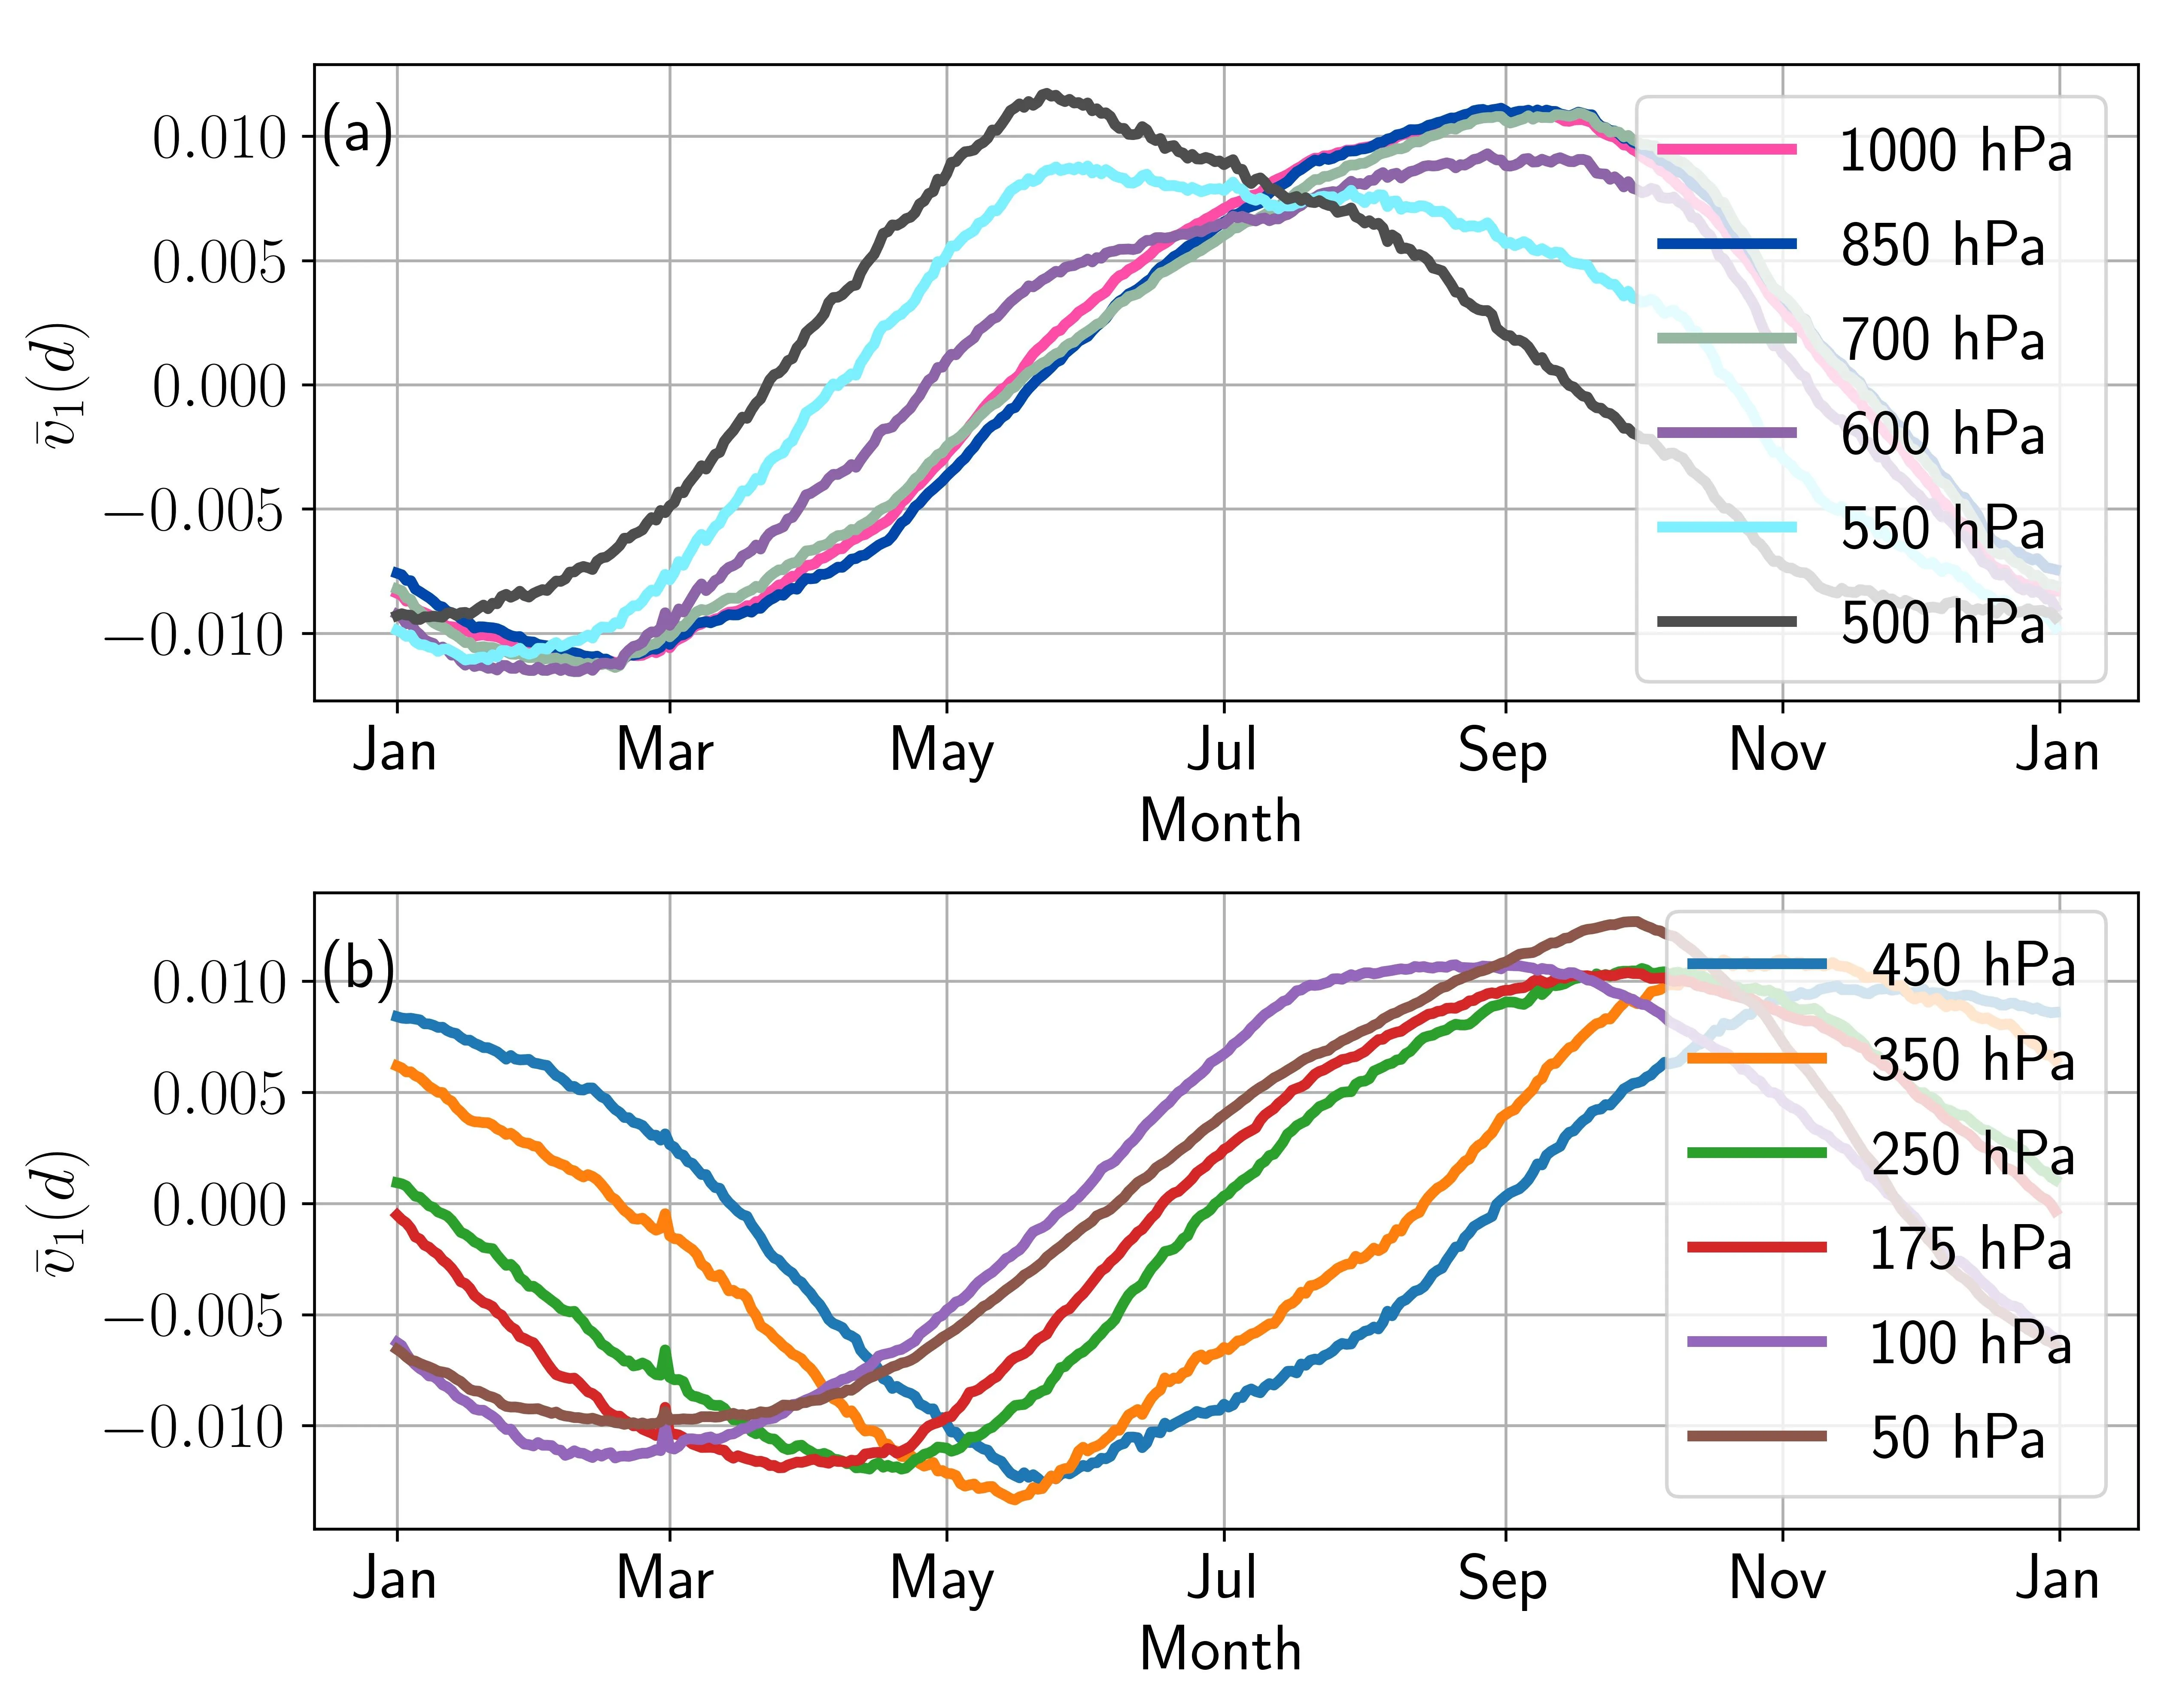
The first and loudest voice is the change of seasons. Its strength varies with altitude: near the surface it explains nearly half of all ozone variability, fades to about 10% at around 9 kilometers, and then regains power in the stratosphere. At the same time, the rhythm itself shifts: if at the ground the ozone minimum occurs in February, at 20 kilometers it does not arrive until June. It is as if the same melody is played with a different delay on different floors of a building.
The other voices are quieter, but no less important. One of them beats in time with El Niño, the warm current in the Pacific that every few years alters weather across the globe. Its contribution grows with altitude: at 14 kilometers, the correlation with the El Niño index is 0.24, and seven kilometers higher, it reaches 0.47. Another voice belongs to the quasi-biennial oscillation, a stratospheric wind that reverses direction every two years or so. At 30 kilometers, this voice sounds especially clear, achieving a correlation of 0.67. And at the boundary between troposphere and stratosphere, where pressure is around 100 hPa, one can hear the echo of the tropopause, the invisible lid that rises and falls with the weather.
Thus ozone is no longer just a number in a table. It becomes a multi-voiced choir in which the conductor's baton of altitude controls the volume of each singer. The method that made this audible is not tied to a single gas: it can be applied to carbon dioxide, ocean currents, or temperature. Then other planetary symphonies will reveal their parts, and we will finally hear how the climate is changing.
The weight of the first ozone mode mirrors the atmospheric temperature profile: both curves have a kink around 300 hPa.