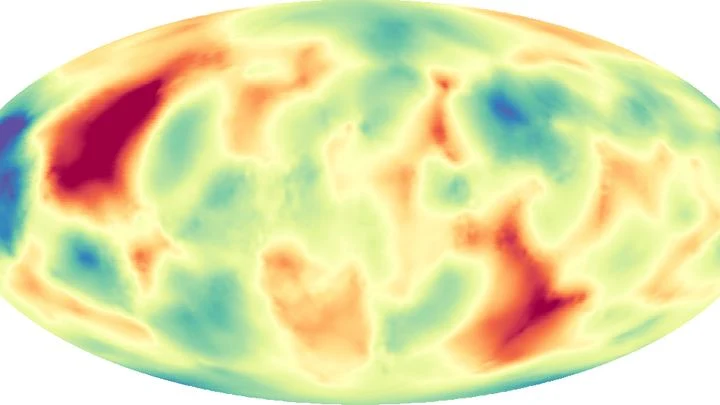
Geopotential height is a measure of the altitude of a constant-pressure surface in the atmosphere, expressed not in ordinary meters but in units that account for the variation of gravity with altitude and latitude. In essence, it tells you how high you would have to climb to reach a given pressure level, but adjusted so that the number directly reflects the potential energy of a unit mass at that height. Meteorologists use it as a fundamental tool to map the large-scale structure of the atmosphere, because on a constant-pressure surface, the geopotential height reveals the temperature distribution and the flow patterns of winds.
History
The concept was formalized in the early 20th century as meteorology adopted pressure-coordinate analysis. Vilhelm Bjerknes and his school in Norway pioneered the use of pressure surfaces for weather analysis around 1910, and the geopotential height became standard with the advent of upper-air soundings in the 1930s and 1940s.
How it works
The atmosphere is thinner at higher altitudes, so pressure decreases with height. A pressure surface, such as the 500 hPa level, is an imaginary surface where the pressure is the same everywhere. Geopotential height is the height of this surface above mean sea level, but corrected for the fact that gravity is slightly weaker at the equator and at high altitudes. The correction ensures that the height is proportional to the gravitational potential energy per unit mass. In practice, warmer air columns expand, pushing pressure surfaces upward, so high geopotential heights indicate warm air, while low heights indicate cold air. The gradient of geopotential height on a pressure surface is directly related to the wind speed through the geostrophic balance, making it a key diagnostic for weather systems.
In practice
Geopotential height maps are the primary charts used in weather forecasting to identify troughs, ridges, and jet streams, and they are also used to track the polar vortex and to study climate variability such as the North Atlantic Oscillation.
Fun fact
On the 500 hPa map, a difference of about 60 meters in geopotential height corresponds to a temperature difference of roughly 1 degree Celsius in the layer below, a rule of thumb forecasters use daily.
The Sun breathes, and that breath has a magnetic rhythm. Every 27 days, the visible surface of the star makes a full rotation, and with it, its magnetic field, like an invisible ribbon wrapped around the star.
Six runners sprint down the track, and officials time their speed without noticing a tailwind. The wind blows at their backs, and the stopwatches show a better result than the truth. Roughly this is how six megamasers — natural cosmic lasers in distant galaxies — misled astronomers measuring the expansion rate of the universe.
Every civilization is born with a gravitational debt. The home planet's mass determines the loan amount, and the Tsiolkovsky equation is the interest rate applied to each kilogram of payload. To send a probe to the stars, you have to pay with fuel, and the debt grows exponentially.
Perth residents know: when the daytime heat becomes unbearable, relief arrives from the ocean — a fresh breeze affectionately called the Freo Doctor. The same wind, only on a global scale, decides the fate of cosmic visitors plunging into the atmosphere. A meteorite fall is a two-act spectacle.
The weather on the next street can differ from yours: cooler by the river, hotter over asphalt, windier between buildings. A regular forecast misses this: its grid cell is the size of a city, not a backyard.
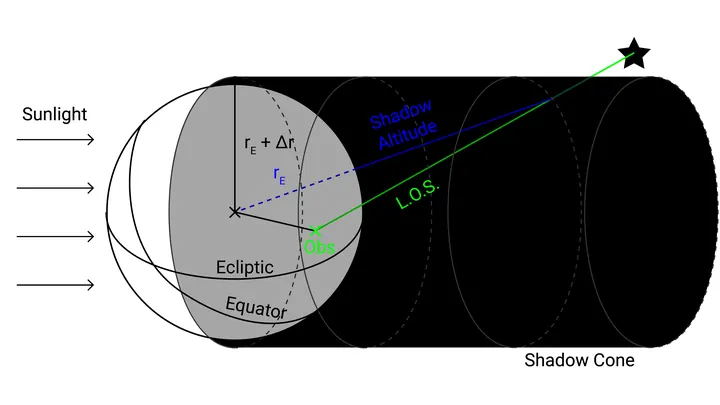
At night, the sky is never completely black. Even far from cities, the upper atmosphere glows faintly: sunlight makes hydrogen atoms emit a reddish glow that astronomers call geocoronal emission. For a telescope, it's like a fogged-up window: it adds extra light and hinders seeing distant galaxies.
Over warm ocean waters, air rises, spins, and turns into a giant vortex that carries winds faster than a race car. For such a vortex to form, several conditions must align: rotation, heat, moisture, and calm winds aloft. Previously, meteorologists combined these conditions into complex indices, like a kitchen recipe with a dozen ingredients.
Setting up an orchestra without a conductor: the algorithm itself decides which instruments (basis functions) and at what volume (weights) should play to reproduce Earth's gravitational symphony.
In the vast concert hall of the atmosphere, ozone plays a part that changes from tier to tier. Near the surface, its notes sound alarming, for there it is a pollutant that irritates lungs and leaves. At 25 kilometers up, the same gas becomes a protective shield that absorbs harsh ultraviolet radiation.