A Pinhole That Sees Chemistry: 3D Element Maps in a Single Shot ✛
In a dark room, a sunbeam passes through a pinprick in cardboard, and an upside-down image of the street appears on the wall. A pinhole camera needs no lenses: the tiny hole itself selects the rays coming from each point of the scene. Scientists at the ESRF applied this principle not to light but to X-rays, and made the camera see not shape but chemical composition.
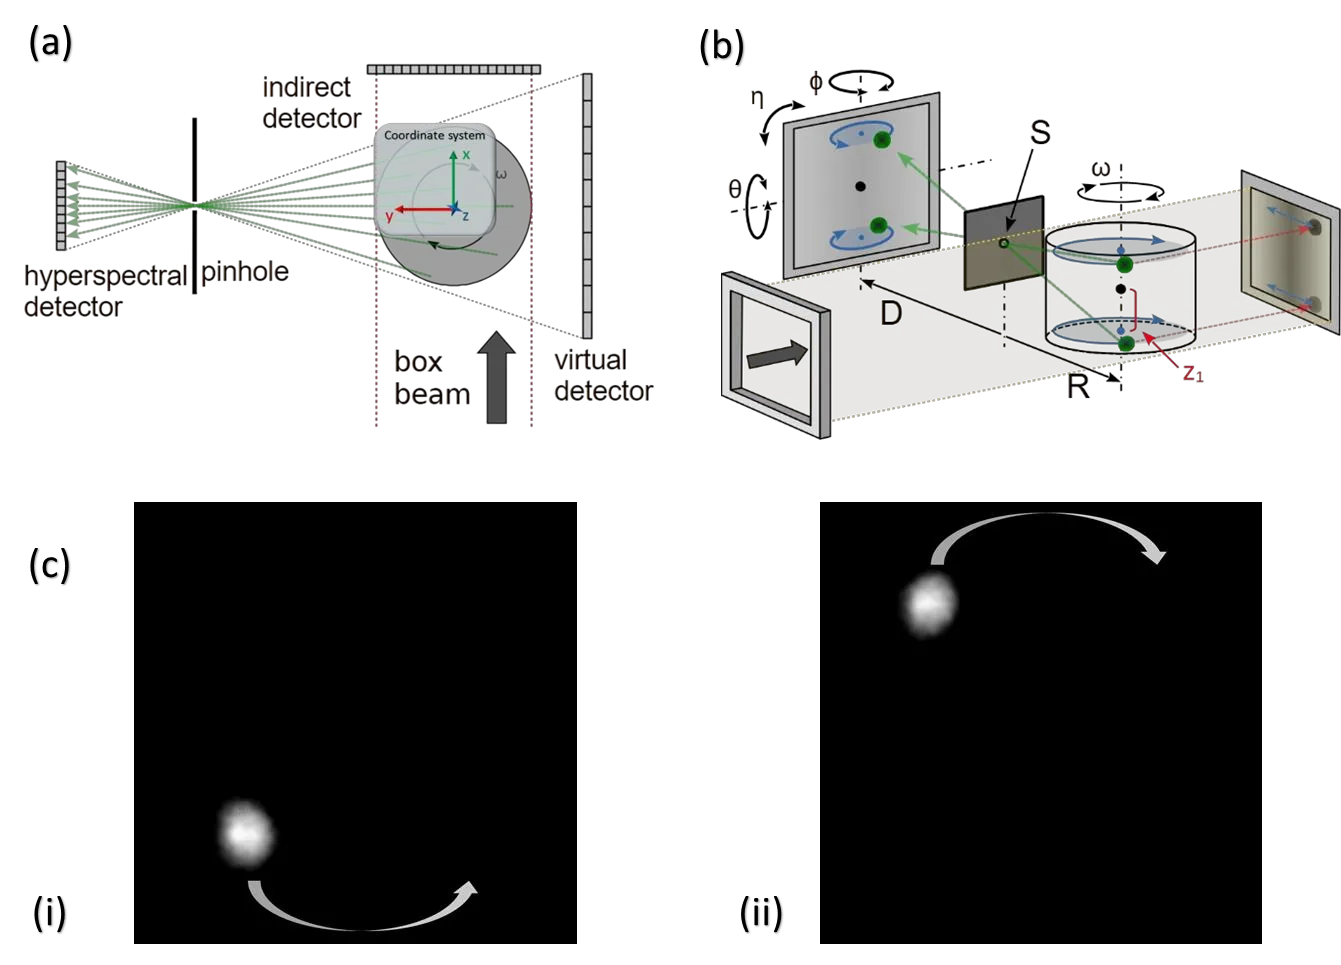
Usually, a 3D element map is obtained by scanning a focused beam across the sample point by point. That is slow, like drawing a portrait by poking a needle into canvas. In the new method, the sample is illuminated as a whole, and its fluorescent glow (secondary X-rays emitted by atoms after excitation) passes through a pinhole 200 micrometers in diameter and hits the HEXITEC detector. This detector records the energy of each photon, much as an ear distinguishes notes in a chord. So in a single shot, information about all elements is gathered at once.
The experimental geometry is equivalent to a virtual cone beam: the pinhole acts as the cone's apex, and the detector as its base. To reconstruct the 3D element distribution, the authors first calibrated the system using projections of a calibration sphere, then refined the parameters by minimizing reconstruction error. This two-step approach is like tuning a musical instrument: first roughly with a tuning fork, then finely by beats.
The method was tested on two samples. A zebrafish embryo stained with silver showed an uneven distribution of the dye in soft tissues: the silver map revealed where the dye had accumulated and where it was almost absent. A geological core of granite and serpentinite separated by elements: barium is localized in granite, while iron is distributed in serpentinite. The spatial resolution of fluorescence is about 150 micrometers, lower than that of phase contrast, but sufficient for a chemical map.
Phase-contrast tomography, acquired sequentially in the same geometry, provides structural context: you see the shape, and overlaid on it, the chemical map. It is like overlaying a color map of air pollution on a black-and-white photograph of a city. Previously, combining these required scanning the sample twice with different methods and then painstakingly aligning the data. Now structure and chemistry are obtained in a single experiment.
The pinhole camera made of cardboard and a pin was once a toy. Now it has become a tool that looks inside matter without destroying it, showing where atoms of silver, iron, and barium hide. The next step is to replace the single hole with a coded aperture to collect more light and improve resolution. Then the pinhole will cease to be a pinprick and become a window into the dynamics of chemical processes.
The accumulation time for one fluorescence projection was 150–170 seconds, with 121 projections in total, about 5.5 hours per dataset. The phase-contrast tomography with 5000 projections took a comparable time.
The idea of seeing the chemical composition of a volume without destroying it evokes the tricorder from 'Star Trek', which scans an object and gives an elemental analysis. F3CT is a step toward such a device, though it still requires a synchrotron.