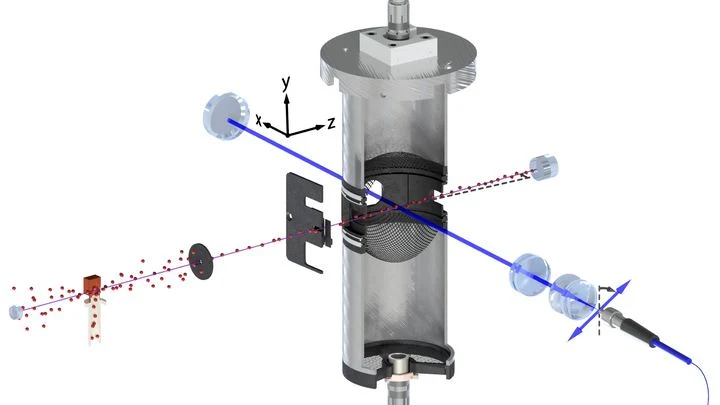
King plot spectroscopy is a precision technique that compares the frequencies of atomic transitions across different isotopes to search for deviations from standard physics. When an atom's nucleus changes (by adding or removing neutrons), the electron energy levels shift slightly—an effect called the isotope shift. By plotting these shifts for two different transitions against each other, one gets a nearly straight line (the King plot). Any tiny nonlinearity in this plot can signal new physics, such as a new force mediated by a hypothetical particle or a variation in fundamental constants.
History
The technique was introduced by W. H. King in 1963 as a way to separate mass and field shift contributions in isotope shifts. Its use as a probe for new physics gained prominence in the 2010s with ultra-precise measurements in ytterbium and other elements.
How it works
The method relies on measuring the isotope shifts for at least two transitions in an atom with high precision, typically using laser spectroscopy. For each isotope, the shift is recorded, and the data are plotted with one transition's shift on the x-axis and the other's on the y-axis. In the standard model, the relationship is linear because the shifts are dominated by two nuclear properties (mass and charge radius). A deviation from linearity—beyond known nuclear effects—indicates an additional contribution, possibly from a new boson coupling to electrons and neutrons.
In practice
Primarily a research tool in fundamental physics, used to test the standard model and search for dark matter candidates or new forces.
Fun fact
King plot spectroscopy is so sensitive that it can detect a hypothetical new particle even if it interacts with matter a billion times more weakly than the electron does.
When heavy nuclei collide in accelerators, a multitude of particles is produced, and physicists want to understand how electric charge moves through this chaos. Two trains crash into each other: the passengers (quarks) scatter, but their luggage (charge) may end up far from the crash site.
The heart beats, and on a paper ECG strip, each beat looks like a sharp spike with two humps: a quick rise, then a smaller wave, then a descent. A doctor looks at such a strip and sees the rhythm, but the shape of each spike, how exactly the muscle contracted, is hard to discern, especially if the recording lasts a full day.
This new method turns that strip into a colorful carpet.
The hydrogen atom is like a tiny clock, ticking with a precision engineers can only dream of. When an electron jumps between orbits, it absorbs or emits light at a strictly defined frequency: that's the 'tick.' In the new work, physicists caught one such transition, between the 2S and 6P states, and measured its frequency with an…
The helium atom is like a tiny solar system: electrons orbit the nucleus, but their orbits are governed by strict rules. Scientists have learned to observe these motions with incredible precision.
Every atom has its own 'voice'—the frequency of light it emits. For isotopes, atoms with different numbers of neutrons, the voices differ slightly. It's like a choir: if you know the score precisely, the slightest false note reveals external interference. The King plot is a way to compare how harmoniously two notes from different isotopes sing together.