How to Hear the Quantum Whisper ✛
When you listen to an echo in the mountains, the time it takes for the sound to return tells you how far away the cliff is. Quantum physicists do something similar with atoms: they send out a radio pulse, and from the returning "echo" they reconstruct what state the atoms were in. This process is called quantum state tomography.
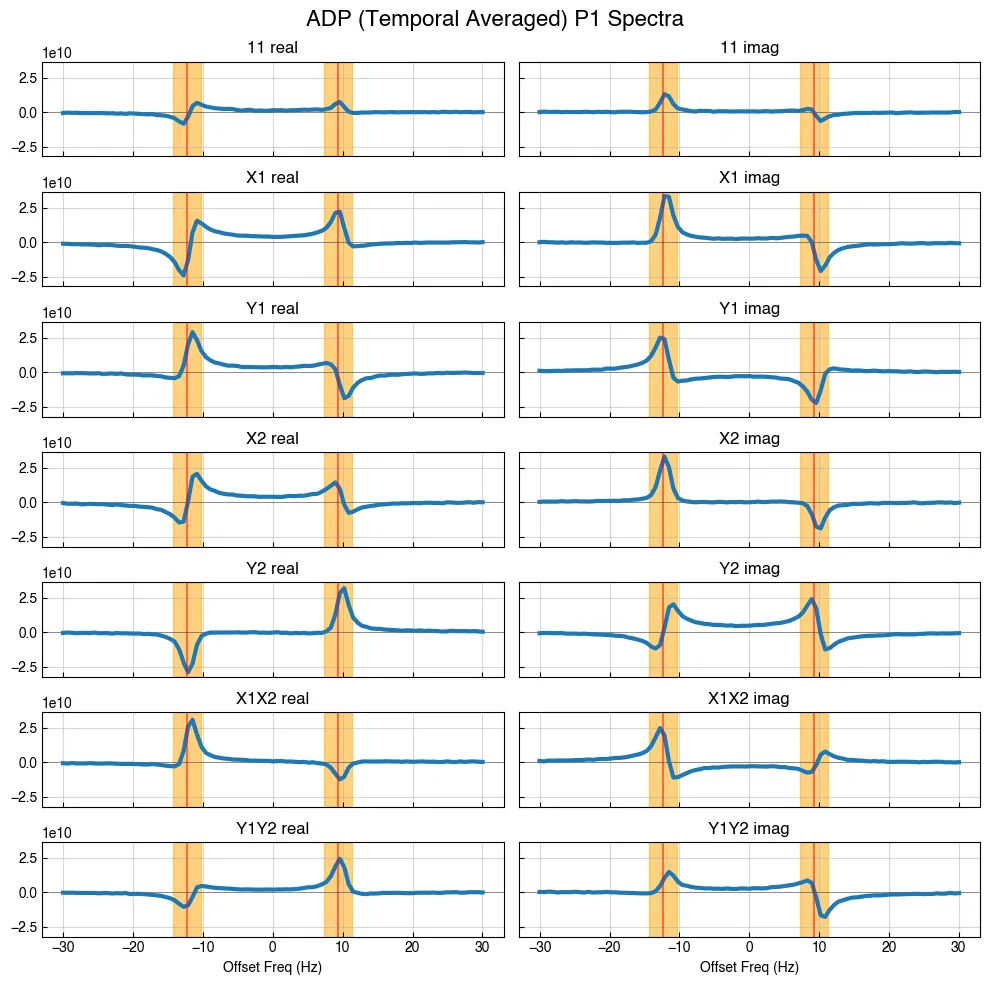
For a long time, the software for this kind of reconstruction was closed. Researchers saw only the final result, never the path itself: how a messy signal becomes a density matrix, that is, an exact mathematical description of the quantum state. The new Tomography-NMR package opens up that path. It takes the raw signal, turns it into a spectrum using a Fourier transform, and then measures the heights of the peaks.
After the measurements, the program imposes physical constraints: the state has to be real, not a mathematical fantasy. Testing on 20 different states showed accuracy above 99%. It is like a translator who makes a mistake in one word out of ten thousand.
In the past, to check someone else's result you had to blindly trust closed code. Now anyone can download Tomography-NMR, run the same data, and compare the answers. This makes science more honest and teaching students more visual. The quantum whisper can finally be heard without intermediaries.
The package is called Tomography-NMR and is distributed under the MIT license, which allows free use in academic and commercial projects. Validation was performed on the ADP molecule, where two phosphorus-31 nuclei are coupled through a J interaction of about 22 Hz.