Multi-Day Rainstorms: How Dynamics Teaches Statistics to Keep Its Cool ✛
Context
Eastern Australia regularly suffers multi-day downpours that trigger catastrophic floods: the 2022 flood in Queensland and New South Wales became the costliest in the nation's history, with insured losses of 3.35 billion dollars. Traditional extreme-value methods, such as block maxima and the generalized Pareto distribution, either ignore the clustering of extremes or destroy it, leaving only an average return time. This work sits alongside studies of nonstationary rainfall models and ENSO influences, but unlike them, it focuses specifically on consecutive days of extreme rain rather than isolated daily maxima or aggregated indices like Rx5day. Related papers in the archive touch on the weather–climate distinction, shifts in rainfall regimes, and predictability of vortices, but none applies a dynamical approach to sequences of extremes.
Methods
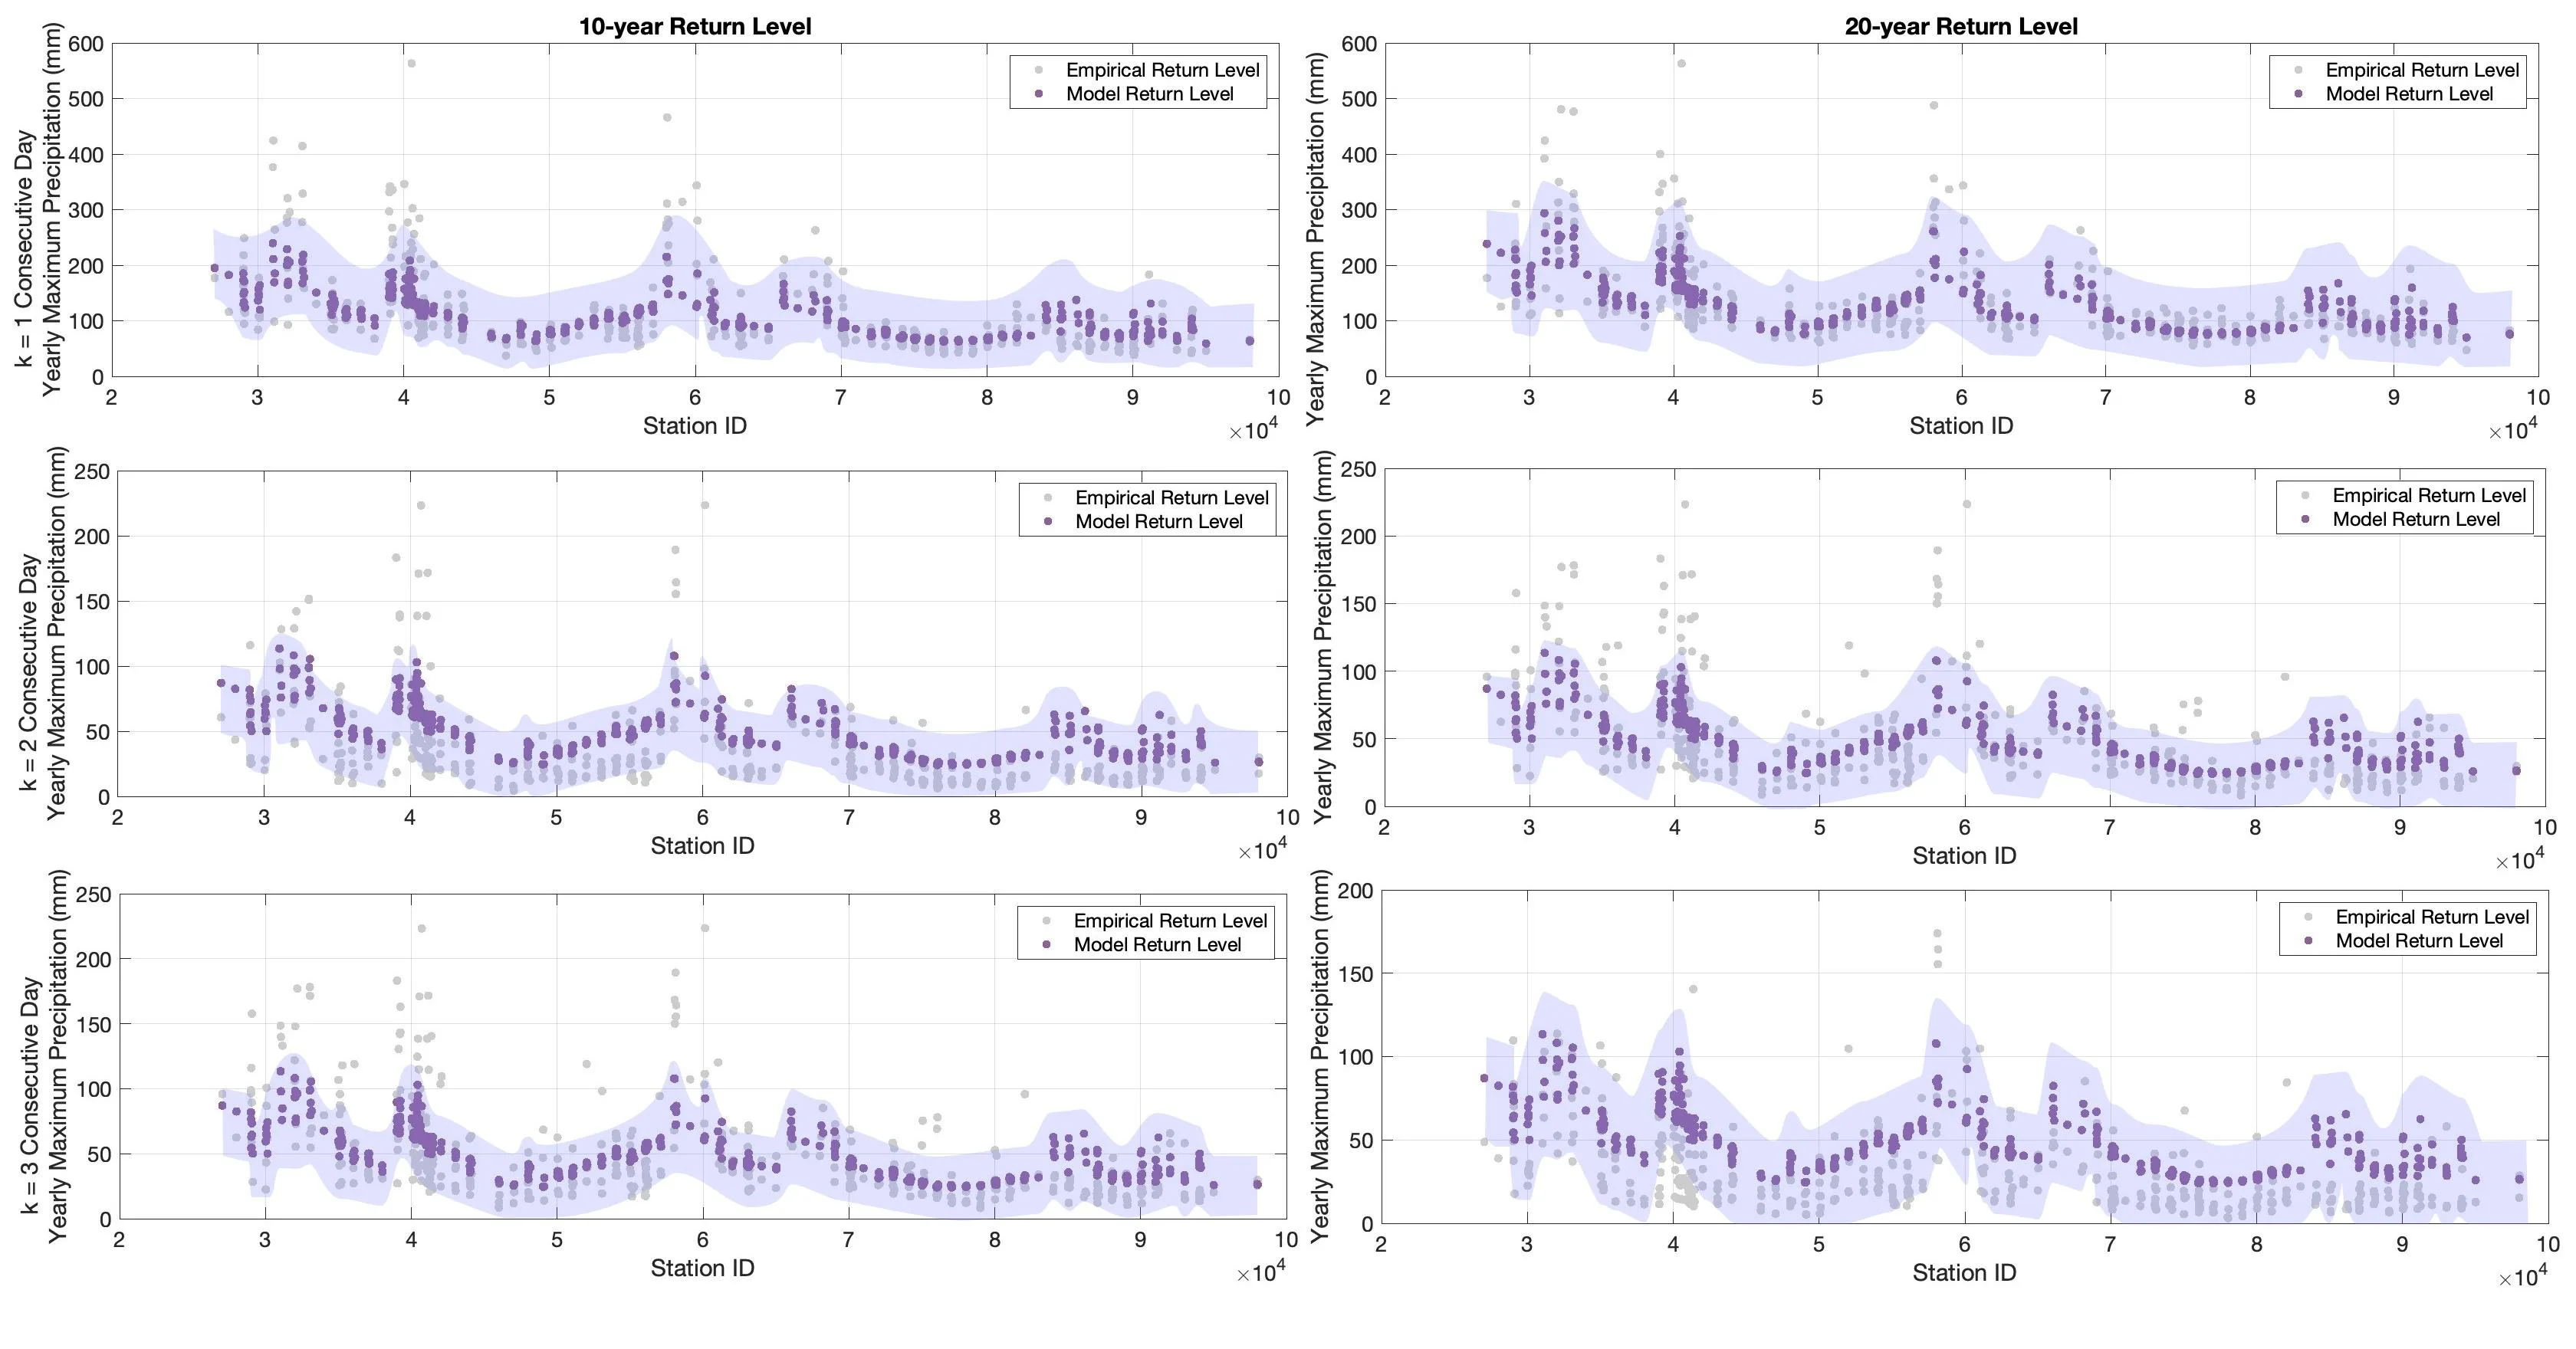
The authors take daily rainfall records from 454 stations of the Australian Bureau of Meteorology for 1984–2021. For each time series, they construct a running minimum over a window of length k (k=1,2,3 days): $Y_j$ = min{$X_j$,...,$X_{j+k-1}$}. They then apply the block maxima method with annual blocks to the resulting sequence and fit a generalized extreme value (GEV) distribution. Nonstationarity is handled by introducing covariates into the location and scale parameters: the Southern Oscillation Index (SOI), logarithm of distance to coast, latitude, and longitude. The shape parameter remains constant. For the extremal index, they use the Ferro–Segers estimator. The key trick: relying on Lemma 4.1 from a recent paper, they require that the shape estimate does not change as the window grows, and use this as a criterion to control numerical error.
Results
The extremal index for Brisbane is estimated at 0.45, which corresponds to an expected cluster of 2.25 days of extreme rainfall and agrees well with observations from the 2022 flood. A spatial map shows that the index is smaller (clusters are larger) in northern Queensland and along the coast, reflecting the movement of large storm systems. The model with covariates SOI, distance to coast, latitude, and longitude is selected by AIC as the best for all windows. The influence of SOI on the scale parameter for three-day extremes is twice as large as for one- and two-day extremes, and stronger inland: for example, at the Karange Model Farm station, the probability of a three-day extreme increases by 4.3% when shifting from El Niño to La Niña, whereas on the coast the increase is 1–1.5%. The max-stability property allows controlling the shape parameter up to window k=3 with a relative error of 52.26%, after which the error jumps sharply due to lack of data.
Implications
This work is the first to apply max-stability from dynamical systems to nonstationary modeling of consecutive extreme rainfall. Unlike neighboring studies that either ignore clustering or average it out via the extremal index, here the physical interpretation of several consecutive days is preserved. This enables more reliable return period estimates for multi-day downpours and reveals hidden numerical errors invisible to standard methods. The authors also show that negative shape estimates in some previous works may be an artifact of insufficient data rather than a true limitation.
Future development
The method can be extended to other regions where rainfall maxima follow a Fréchet distribution. The authors plan to develop similar techniques for heatwaves, using results on max-stability for windowed averages. An open question remains the optimal choice of block length as a function of window size, which requires studying convergence rates.
Impact
The results could improve flood risk assessment for infrastructure planning, urban design, and agriculture in regions prone to multi-day downpours.
Next steps
Conduct numerical studies of convergence rates to choose the optimal block length and incorporate these corrections into more robust distribution fitting methods.
Key open problems
This work directly addresses the unresolved problem of modeling clustered extremes in nonstationary time series. Traditional approaches either lose information about the sequence or require unrealistic independence assumptions. Here, a way to preserve cluster structure is proposed, relying on theoretical guarantees from dynamical systems, which opens the path to more accurate estimates of rare events in hydrology and climatology.
The knowledge machine's view
This section is addressed to the author of the paper and their colleagues. Neighbouring works were found by meaning-based search across our archive, not by word overlap. We do not review: we show the field around the work.
What the work does
The authors analyze multi-day extreme rainfall in eastern Australia using running minima over 1–3 day windows and fitting a non-stationary GEV distribution with SOI, distance from the coast, latitude, and longitude as covariates. They exploit the max-stability property to control the numerical error in the shape parameter and estimate the extremal index, showing that the El Niño effect on three-day extremes is twice as strong as on one-day extremes, especially inland.
Where its strength is
A strong point is the transfer of the dynamical max-stability property to the statistical modeling of successive extremes, which explicitly accounts for rainfall clustering and links it to physical mechanisms such as the movement of storm systems and ENSO phases.
Where it could go next
- It might be interesting to see how the proposed running-minima method relates to alternative ways of accounting for clustering in non-stationary models, such as the approaches discussed in the work on methodological insights in climate complexity.based on: Untangling Climate Complexity: Methodological Insights arXiv:2405.18391
- A related paper on El Niño phases and rainfall extremes considers not only the strength but also the temporal structure of the response; comparing with it could clarify how different ENSO phases affect the duration of extreme rainfall clusters.based on: Breathing of Tropical Rains: How El Niño Phases Drive Precipitation Extremes arXiv:1604.04050
- There is a review in the archive on the distinction between weather and climate signals; it would be interesting to check how far the identified patterns of multi-day extremes reflect synoptic processes rather than just large-scale climate indices.based on: Echo in the Mountains: How to Tell a Human Voice from Nature's arXiv:2308.07560
Worth trying
- Test whether the max-stability property holds for windows k>3 when using longer records or pooling stations into regional groups.
- Compare extremal index estimates from the running-minima method with those from point-process or other clustering models.
- Use covariates describing synoptic system types (e.g., East Coast Lows) to link cluster size to specific weather mechanisms.
Why this may matter
If the running-minima method proves robust and physically interpretable, it could become a useful tool for assessing multi-day flood risk under a changing climate, particularly in regions where not only intensity but also duration of extreme rainfall matters.
Nearby works in our archive
- Untangling Climate Complexity: Methodological Insightssimilarity 0.55
- Echo in the Mountains: How to Tell a Human Voice from Nature'ssimilarity 0.55
- Two Steps to a Sharper Forecast of Cloudburstssimilarity 0.54
- Breathing of Tropical Rains: How El Niño Phases Drive Precipitation Extremessimilarity 0.54
- Storm in the Climate Labyrinthsimilarity 0.53
The archive is sparse around this work: the closest review is only 0.55, against a usual 0.64. It looks like few have drilled nearby.
The 2022 Australian flood, caused by 2–3 days of heavy rain, caused 3.35 billion dollars in insured damage, making it the most expensive flood in the country's history.
Key numbers
- Observation stations: 454
- Data period: 1984–2021
- Insured losses from 2022 flood: 3.35 billion dollars
- Extremal index for Brisbane: 0.45
- Relative shape error at k=3: 52.26%