The term 'reanalysis' distinguishes this process from operational weather analysis, which is done in real time for forecasting. In reanalysis, the same model version is used for the entire historical period, avoiding the inconsistencies that would arise from model updates. This makes the dataset suitable for long-term climate studies, as changes in the data reflect real atmospheric variations rather than artifacts of model changes. Major reanalysis products include ERA5 from the European Centre for Medium-Range Weather Forecasts (ECMWF) and the Modern-Era Retrospective analysis for Research and Applications (MERRA) from NASA.
History
The first major reanalysis efforts began in the 1990s, led by organizations like NASA and ECMWF, building on earlier operational analysis systems. The National Centers for Environmental Prediction (NCEP) and the National Center for Atmospheric Research (NCAR) produced the first widely used reanalysis, the NCEP/NCAR Reanalysis, in 1996. Since then, successive generations have improved resolution, physicalparameterizations, and the handling of observations.
How it works
The model also provides variables that are not directly observed, such as surface heat fluxes or soil moisture, by using physical laws to relate them to the assimilated variables. However, these derived quantities are less reliable than the directly assimilated ones, as they depend on the model's parameterizations. The quality of a reanalysis depends on the density and accuracy of the observations, which improve over time, especially with the advent of satellite data in the late 1970s. This means that reanalysis datasets are more uncertain in the earlier decades, and users must account for this when analyzing long-term trends.
In practice
Reanalysis datasets are used for climate monitoring, such as tracking global temperature anomalies, and as boundary conditions for regional climate models, as well as for validating weather and climate forecasts.
Fun fact
The ERA5 reanalysis dataset, released in 2019, provides hourly estimates of hundreds of variables from 1940 to the present, and its production required processing over 10 petabytes of data.
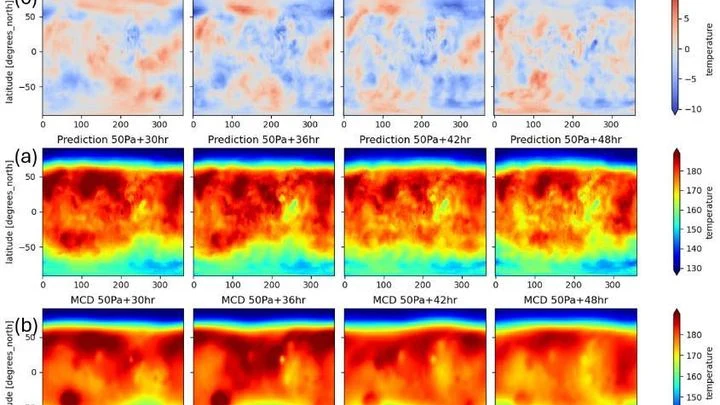
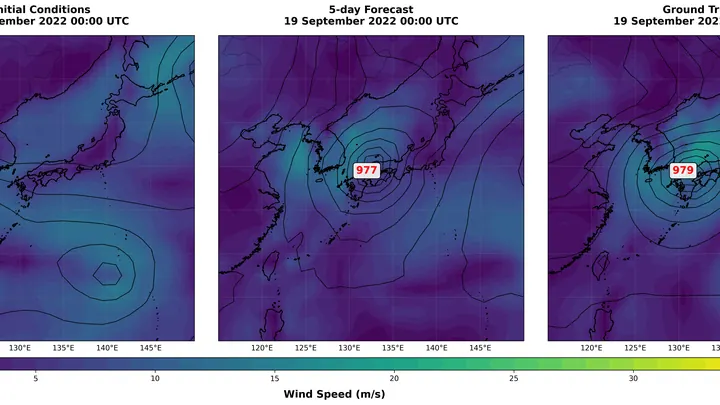
Meteorologists have grown used to trusting neural networks: the GraphCast model predicts Earth's weather days ahead by drawing on global snapshots of the atmosphere. But this 'brain' can be transplanted to another planet — where the air is thin and the Sun warms differently.
Unlike regular cameras, event-based ones only record moments when light becomes brighter or dimmer. They don't produce snapshots; instead, they send an endless stream of such flashes. Scientists turned this stream into a sharp picture of the Earth while flying over it on a satellite. Each flash is like a piece of a mosaic; together they form a still image.
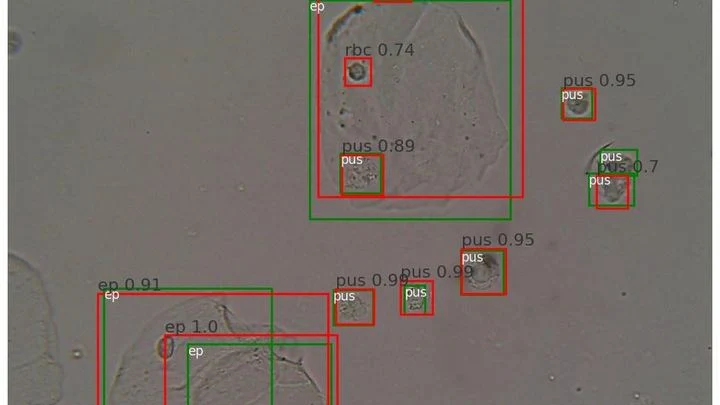
A drop of urine under a microscope isn't a flat puddle but a multi-layered volume. Like a stack of transparent pages: if you focus on one, the neighboring ones blur. The microscope's light only shows one depth layer sharply. To see all the cells, a lab technician had to take a series of snapshots, manually adjusting focus — tedious and slow.
At a weather station in Brazos County, Texas, rain is recorded on magnetic tape: every day, four years straight. Nine hundred millimeters in a good season, a hundred in a bad one. Then the tape falls silent. Drought creeps in without a sound — the slow fading of the earth's pulse. The standard SPI-3 index only catches on a month or two later, once the moisture is already gone.
For decades, global atmospheric models resembled artists forced to paint planetary storms with coarse brushstrokes: a resolution of 25–100 km forced them to 'guess' convection through approximate schemes, introducing systematic errors in rainfall and climate forecasts.
The MethaneSAT satellite scans for leaks of метана — a gas that's invisible but packs a powerful planetary warming punch. Its "nose" is a спектрометр, a device that spots the subtlest color changes in light passing through the atmosphere — the telltale sign of methane.
A mosaic of large colored tiles. Each tile is the average precipitation over an entire month for an area the size of a small country. For a general understanding, the picture is fine, but if you need to know whether a downpour hit a specific city yesterday, it's useless.
When a person breathes, air doesn't flow in a steady stream but in waves. Previously, doctors and scientists only looked at overall numbers: how much air entered per breath, what the peak flow was. But within a single breath, there are nuances — small variations that speak to the workings of nerves and muscles. The new approach breaks a breath into parts, much like a musician breaks a chord into individual notes.
Weather forecasting is like trying to predict where a rock will roll down a slope, knowing the shape of every bump and the force of the wind. Make a mistake at the start, and a week later that error grows into a full-blown storm. In the past, accurate forecasts required massive computers and days of computation.
In 2023, the ocean off the coast of Peru warmed so much that fishermen came back empty-handed, while meteorologists argued over the strength of the upcoming El Niño. The sea surface temperature map they were looking at was the only one available, but how much could they trust it?
Solar flares — sudden energy releases on the Sun — can knock out satellites and power grids. Previous models often either cried wolf or missed a real blow. The fix: attach a reliability estimate to every prediction.
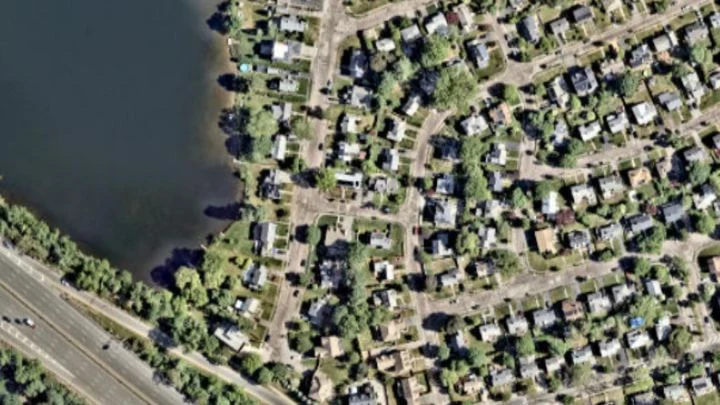
The weather on the next street can differ from yours: cooler by the river, hotter over asphalt, windier between buildings. A regular forecast misses this: its grid cell is the size of a city, not a backyard.
Old Chinese chronicles are full of weather entries: "no rain in the third month," "the river overflowed its banks." But these are words, not numbers. Until now, turning them into precise precipitation data was nearly impossible.
The new approach works like a translator from the language of chronicles to the language of climatology.
Every spring, El Niño forecasts lose their edge, like a translator who gets distracted by every rustle in the room and turns a one-hour meeting into a two-hour one. Scientists call this the spring predictability barrier: in March and April, models that confidently predicted a warm phase in the Pacific back in January start making mistakes twice as often.
Measuring a particle’s energy at the Large Hadron Collider is like trying to catch a whisper in a roaring crowd. When protons collide, a flurry of particles is born, their signals blending into a cacophony. Old-school methods, like a noise-clogged ear, systematically underestimate the energy.
Scientists built a neural network that works right inside the detector.
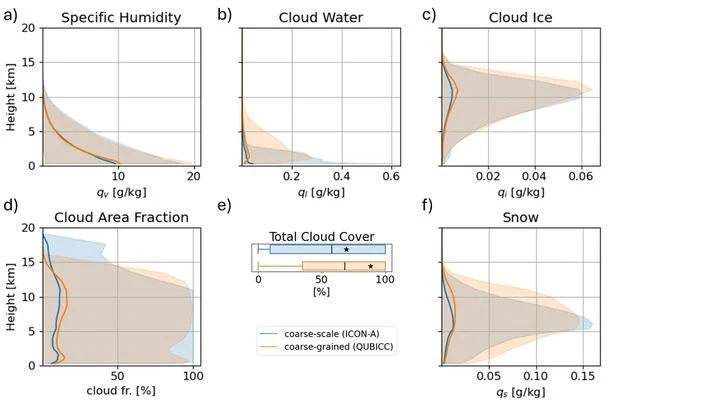
Climate forecasting is like a complex recipe: one wrong pinch and the whole dish is ruined. So it is with clouds — small but decisive. Climate models divide the sky into 50–100 km cells and don't see individual clouds. It's like throwing pepper by the handful when the recipe calls for a pinch.
A translator at a high-stakes negotiation doesn't just render words quickly; they make sure the meaning doesn't get lost. CAMulator does the same: it takes the complex climate model CAM6 and translates it into the language of a neural network that runs hundreds of times faster, without losing the physical essence.
An interpreter at negotiations hears only the words already spoken, yet still guesses the next phrase. This is how the new El Niño forecasting method works: it doesn't peek into the future but relies solely on the past, like an honest listener.
A translator at negotiations picks up not only the words but also the tone in which they are spoken. If they focus only on vocabulary, they might miss sarcasm or fatigue in the voice. If only on intonation, they could mistranslate the details of the contract.
In February 2022, the eastern coast of Australia was hit by rains that lasted several days in a row. Water inundated towns in Queensland and New South Wales, insurers paid out 3.35 billion dollars, and the flood became the costliest in the country's history.
Every year, the same drama unfolds over West Africa: from June to September, the sky fills with moisture and releases rains that determine the harvests of millet, sorghum, and maize. This rainy season is driven by the West African monsoon, a giant atmospheric pump that pulls moist air from the ocean deep into the continent.
An interpreter at a negotiation hears not only the volume of the voice but also the shift in topic. Climatologists have long listened only to volume: the average temperature. If it rises, the planet is warming. But behind the average hide events that matter more than the trend: heat waves, cold snaps, sudden changes.
A meteorologist looks at a map where clouds gather in flocks, like birds before a storm. Each spot on the radar could be a future downpour or just noise. Earth system forecasting is like trying to assemble a puzzle with thousands of pieces that keep changing shape.
In 1960, a meteorologist at a station in Peru records water temperature, while a farmer in India watches the sky waiting for the monsoon. There is no direct link between these two events, but months later one will echo in the other.
A farmer in Iowa looks at the calendar: plant now or wait? In a month, a heat wave might strike, or rain might set in. Forecasters throw up their hands: the two-week forecast still holds, the seasonal one is out of reach, and in between lies a gap. The atmosphere changes too quickly to remember yesterday, and the ocean is too slow to come to the rescue.
Earth's climate resembles a choir, where each member sings their own part at their own pitch. Some voices hold low notes, like multi-year ocean temperature oscillations, while others produce rapid trills, like short atmospheric waves. The conductor needs to hear each one, but the voices overlap and the notes blend into a mush.
A wave travels westward, reflects off the coast, and returns six months later to alter temperatures along the eastern Pacific. This journey of Rossby and Kelvin waves Mori-Zwanzig formalism turns into an equation with memory. Previously, climatologists added delays to El Niño models by intuition, relying on physical insight.
A translator who hears only the meaning, not the noise in the hall, can convey a conversation accurately. Climatologists have long sought such a translator for the ocean–atmosphere pair: their interaction resembles a dialogue where voices drown in the roar of extraneous sounds.
The ice cover of a river looks solid, but beneath it lie cracks that alter the flow. So it is with a time series: behind the smooth surface of numbers hide moments when the rules of the game change. These moments are called change points, and finding them is like tapping the ice to locate weak spots.