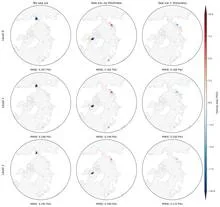
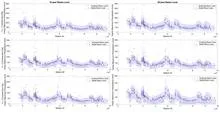
Data assimilation is a statistical technique used to estimate the state of a complex system, like the atmosphere or ocean, by merging two sources of information: a model that predicts how the system evolves, and observations that measure parts of it. The model provides a complete, physically consistent picture, but it drifts from reality over time. Observations are accurate but sparse and irregularly spaced. Data assimilation finds the best compromise between these, producing a state estimate that is both physically plausible and close to what was actually measured.
History
The conceptual foundations were laid in the 1960s, with the Kalman filter (1960) and variational methods developed by Sasaki and others later that decade. It became a standard tool in numerical weather prediction in the 1980s and 1990s.
How it works
The process typically runs in cycles. First, a modelforecast advances the current best estimate forward in time. Then, when new observations arrive, an algorithm (such as a Kalman filter or variational method) compares the forecast to the observations, weighting each by their uncertainties. The result is an updated state, called the analysis, that minimizes the overall error. This analysis becomes the starting point for the next forecast, so the system continuously corrects itself.
In practice
It is the backbone of modern weather forecasting, used by meteorological centers worldwide to initialize their prediction models with the best possible estimate of the current atmospheric state.
Fun fact
The same mathematical framework is used to estimate the Earth's interior structure from seismic waves and to track the position of satellites in orbit.
Two photographers shoot the same mountain. One takes a hundred shots from the summit and only a couple from the base; the other does the opposite. If you try to align their images, the algorithm might decide that the summit in one photo matches the summit in the other simply because there are many similar points there, not because it's the same spot. Sampling density throws it off.
Usually, the complexity of systems, from satellite motions to heart rhythms, is assessed with averaged entropy (a measure of unpredictability, as understood by Boltzmann). But that's like evaluating the ocean only by wave height: the average figure hides the full richness of underwater currents.
For decades, global atmospheric models resembled artists forced to paint planetary storms with coarse brushstrokes: a resolution of 25–100 km forced them to 'guess' convection through approximate schemes, introducing systematic errors in rainfall and climate forecasts.
Statistical models are an attempt to stretch a perfect mathematical web over the uneven landscape of data. When a model resists, it emits tension, but we've grown accustomed to ignoring it. Researchers spend hours staring at residual plots, trying to guess where the model is 'coming apart at the seams.' Squealer translates this resistance into sound.
A student who has spent years solving problems from other people's textbooks suddenly receives three notebooks with real ocean observations. There are few problems, but they have already seen hundreds of similar ones, and now a couple of examples suffice to catch the new teacher's style.
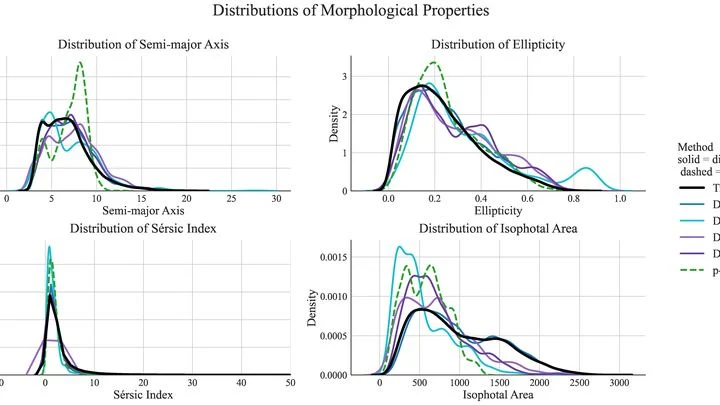
An artist paints a portrait stroke by stroke, and then someone offers them a flash camera — one click, and it's done. That's roughly the shift from multi-step models to one-step models in generating images of galaxies.
Typical neural networks for image synthesis work like a watercolorist: they apply a layer, blur it, add details.
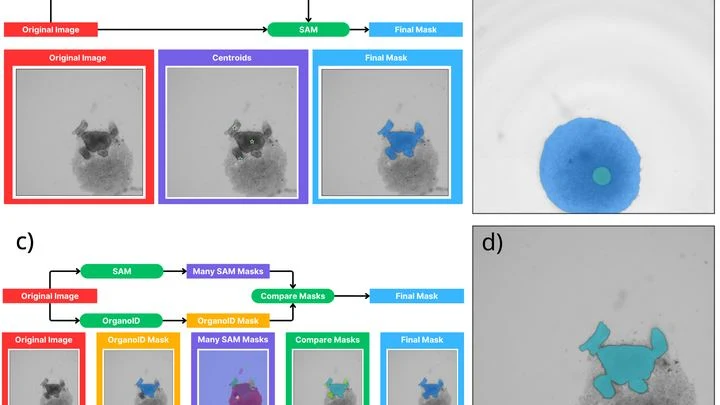
A biologist looks through a microscope at dozens of tiny cell spheres — spheroids. From these, miniature organ-like structures will later grow. The task is similar to a baker's job of checking whether the dough has risen evenly in each mold. Only here, instead of molds, there's a nutrient medium, and instead of dough, there are living cells.
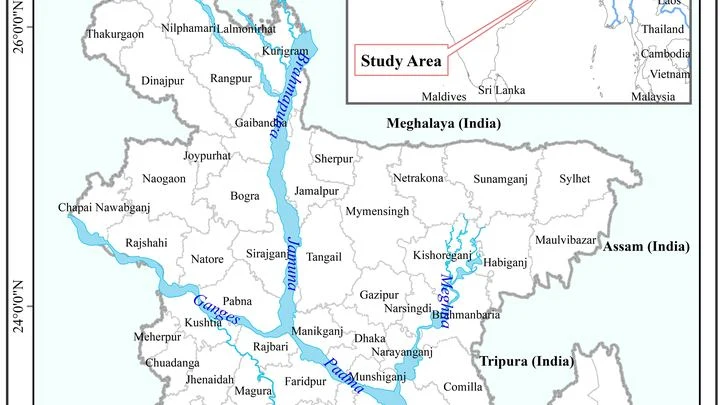
A rice field by the sea may look green, but the stalks are stunted and the grains are shriveled. Salt has silently poisoned the soil. In Satkhira district in southern Bangladesh, every farmer knows this scene. Salty water comes in with the tides, seeps into the ground, and the land stops yielding. To fight the problem, you first need to know where the salt is hiding beneath the roots.
A charged particle spiraling in a magnetic field doesn't stay silent: it emits light. This light is called synchrotron radiation, and it shows up everywhere — from distant galaxies to laboratory accelerators.
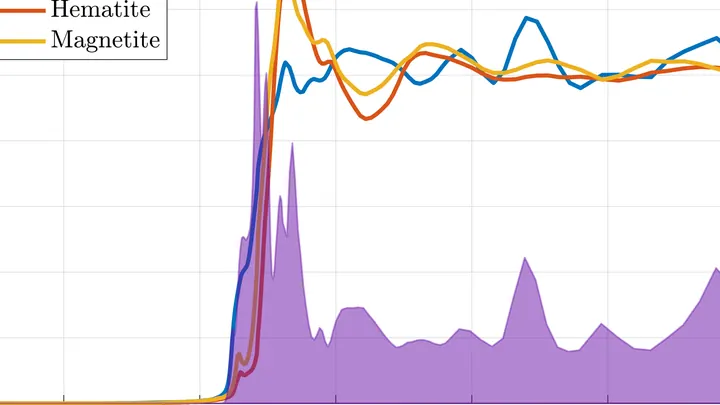
A chemical map of a sample is like a mosaic: each point has its own color, its own chemical composition. To assemble such a mosaic, a spectromicroscope scans the sample point by point, recording a spectrum at each location — a "fingerprint" of how the material absorbs or emits light.
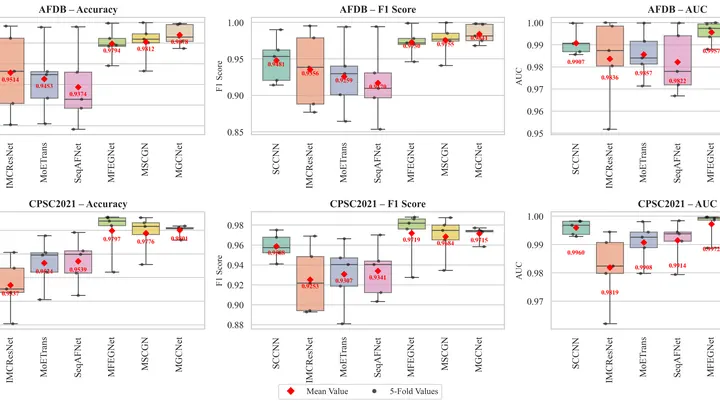
The heart doesn't beat like a metronome but like a jazz drummer: sometimes it stumbles, skips beats, or races. Atrial fibrillation is one of the most insidious glitches: the atria quiver instead of contracting, and blood can pool, forming clots. Doctors catch this glitch on an ECG — a recording of the heart's electrical signals.
An orchestra of two musicians plays from the same score, but each hears only their own line. The atmosphere and ocean in a climate model resemble such a duet: they exchange heat and moisture every few hours, yet until recently their neural network counterparts could not keep a common rhythm.
For 36 days, tropical cyclone Freddy raged over the Indian Ocean, the longest-lived cyclone on record. Meteorologists tracked it from satellites, aircraft, and ground stations. But one detail eluded all instruments: the precise air density deep within the vortex. And that density determines where the cyclone will turn tomorrow.
A translator that learned the grammar of the wind, not just the vocabulary. The wind blows over the Pacific, and the water responds with waves, currents, and upwellings of cold depths. The KIST-Ocean neural network was taught not just to memorize how the ocean looked yesterday, but to understand why it will become what it is tomorrow.
Climate is like an orchestra without a conductor: each musician hears the others with a delay, and the score changes mid-concert. The ocean, atmosphere, ice, and land continuously exchange energy, and the slightest hiccup in one instrument can escalate into a shift of the entire melody.
In February 2022, the eastern coast of Australia was hit by rains that lasted several days in a row. Water inundated towns in Queensland and New South Wales, insurers paid out 3.35 billion dollars, and the flood became the costliest in the country's history.
A meteorologist stares at a pressure map, trying to figure out where the cyclone will go. They have a model, but it is flawed, and fresh measurements, but they are incomplete. Merging the two so that the forecast remains physically meaningful is harder than it seems: classical methods sometimes produce negative temperatures or impossible probabilities.
On April 16, 2012, Washington experienced heat no one expected. The thermometer climbed 18 degrees above normal. Sixty days earlier, Bucharest and Kyiv had weather unusual for them. The link between these events was found by an algorithm that scans pairs of cities worldwide, looking for recurring coincidences.