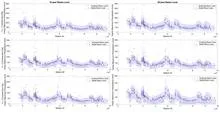
Composite analysis is a way to find a clear pattern hidden in noisy data by lining up many separate instances of the same kind of event and averaging them. For example, if you want to know what the weather typically does after a volcanic eruption, you take all the eruptions on record, align them at the moment of eruption, and average the temperature readings for each day before and after. Random fluctuations—like a stray heat wave or a passing storm—tend to cancel out in the average, while any consistent response to the eruption stands out clearly.
History
The technique has roots in early 20th-century meteorology, where it was used to study the effects of phenomena like solar flares on weather, but its formalization as a standard tool in climate science came later.
How it works
The method works by selecting a set of time windows, each centered on an occurrence of the event of interest. For each time offset relative to the event, you compute the mean of the variable across all windows. The result is a single averaged curve that represents the typical evolution around the event. Statistical tests, such as comparing the average to the variability across windows, help decide whether the apparent signal is real or just noise.
In practice
It is widely used in climate research to isolate the impacts of events like El Niño, volcanic eruptions, or sudden stratospheric warmings from the background of natural variability.
Fun fact
Composite analysis is sometimes called 'superposed epoch analysis,' a name that reflects its use in astronomy to study the effects of solar storms on cosmic ray counts.
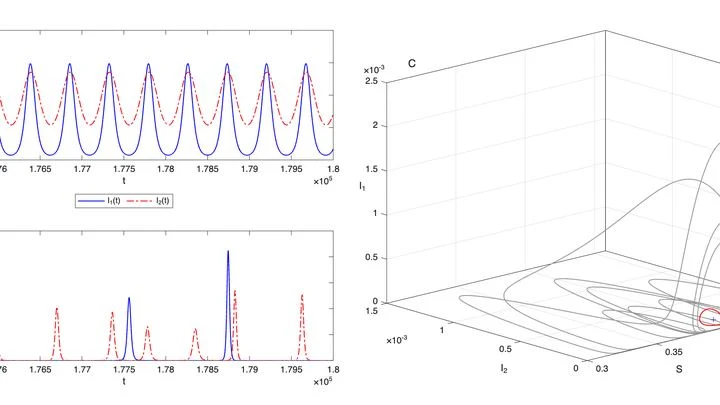
Every winter, hospitals fill up, and by summer they seem to empty. Epidemics breathe like the tide. But why do waves of disease keep rolling in, even without new mutations? Mathematicians found an answer in a tug-of-war between two strains.
Within a single epidemic, two virus variants often coexist.
Usually, the complexity of systems, from satellite motions to heart rhythms, is assessed with averaged entropy (a measure of unpredictability, as understood by Boltzmann). But that's like evaluating the ocean only by wave height: the average figure hides the full richness of underwater currents.
Unlike regular cameras, event-based ones only record moments when light becomes brighter or dimmer. They don't produce snapshots; instead, they send an endless stream of such flashes. Scientists turned this stream into a sharp picture of the Earth while flying over it on a satellite. Each flash is like a piece of a mosaic; together they form a still image.
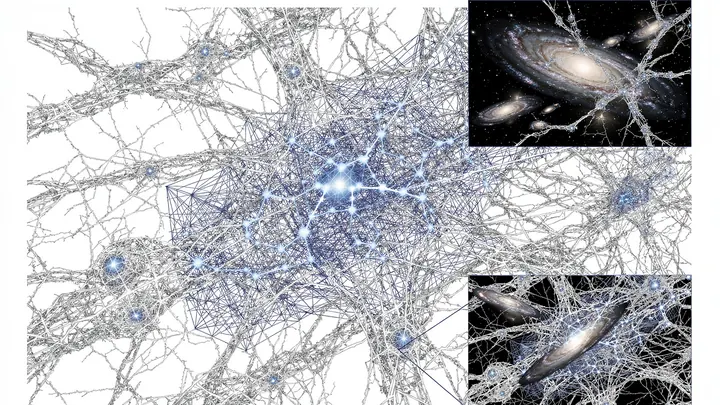
Light from distant galaxies travels to us for billions of years, but along the way it gets bent and twisted by the invisible web of dark matter. This effect, predicted by Albert Einstein within general relativity, is called gravitational lensing.
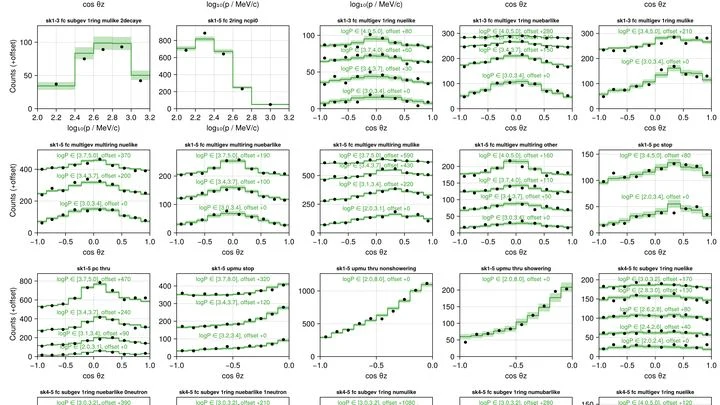
Neutrinos are often compared to a radio broadcast picked up by different receivers. One station sends a signal, but antennas in Japan, Antarctica, and at the bottom of the Mediterranean Sea hear it differently — due to distance, interference, and antenna orientation.
The heart beats steadily, then slips into arrhythmia. The climate holds its familiar rhythm for decades, then shifts to a new state over a single summer. Such regime shifts are like a flick of a switch, but in real data we see only a noisy one-dimensional signal in which the moment of the break is hidden.
During a course of radiation therapy, the tumor and surrounding tissues can shift or change size. Doctors regularly take images and sometimes adjust the plan to keep the radiation on target. But how do you know how much dose has already been delivered and how much is still to come? Usually, this is estimated using simple rules that don't account for uncertainty.
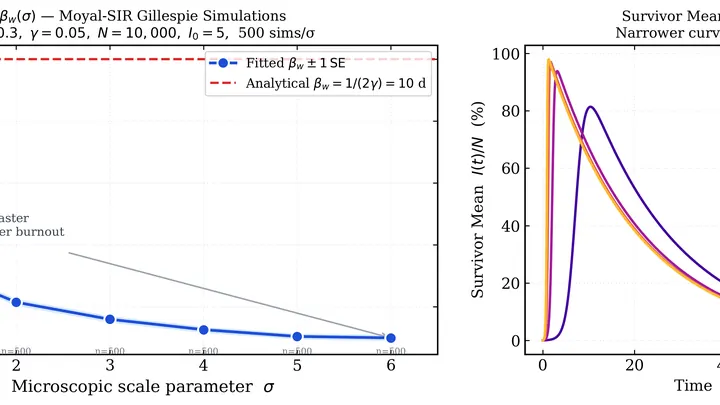
An epidemic is not a steady stream but a series of hits. One carrier may infect no one, while another infects fifty people at once. Such rare but powerful events are called 'dragon kings': they stand out from the overall pattern and determine how severe a disease wave will be.
In the new study, the virus is compared to a billiard ball.
Old Chinese chronicles are full of weather entries: "no rain in the third month," "the river overflowed its banks." But these are words, not numbers. Until now, turning them into precise precipitation data was nearly impossible.
The new approach works like a translator from the language of chronicles to the language of climatology.
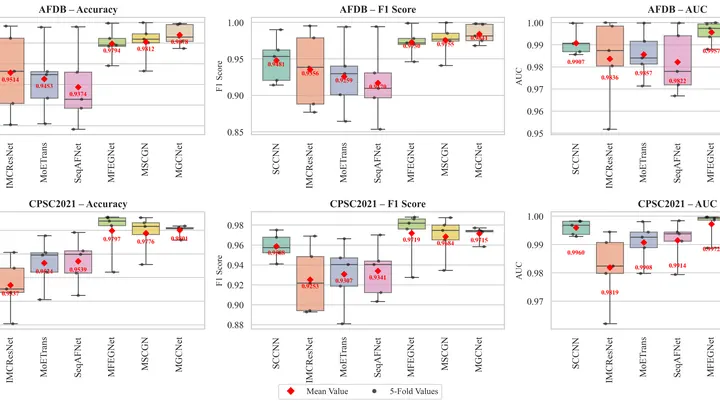
The heart doesn't beat like a metronome but like a jazz drummer: sometimes it stumbles, skips beats, or races. Atrial fibrillation is one of the most insidious glitches: the atria quiver instead of contracting, and blood can pool, forming clots. Doctors catch this glitch on an ECG — a recording of the heart's electrical signals.
In February 2022, the eastern coast of Australia was hit by rains that lasted several days in a row. Water inundated towns in Queensland and New South Wales, insurers paid out 3.35 billion dollars, and the flood became the costliest in the country's history.
A long conversation between two people can be condensed into a few key phrases that preserve the essence. That is exactly how a macrovariable works: temperature stands in for billions of moving molecules, and sea level for thousands of waves.