Who Conducts the Antarctic Snow: Two Ice Cores Against Climate Indices ✛
Context
East Antarctica has long been overshadowed by dramatic ice losses in the west, but it is here, in Dronning Maud Land, that the ice sheet gained mass during 2002–2019. To separate the contribution of global warming from natural climate rhythms, scientists turn to ice cores: the oxygen isotope composition serves as a thermometer of the past. Previous studies in this region relied on correlations and found links with El Niño and the Southern Annular Mode, but correlation does not indicate the direction of influence. Two new cores, drilled a hundred kilometers apart, offered a rare opportunity to test how local such links are.
Methods
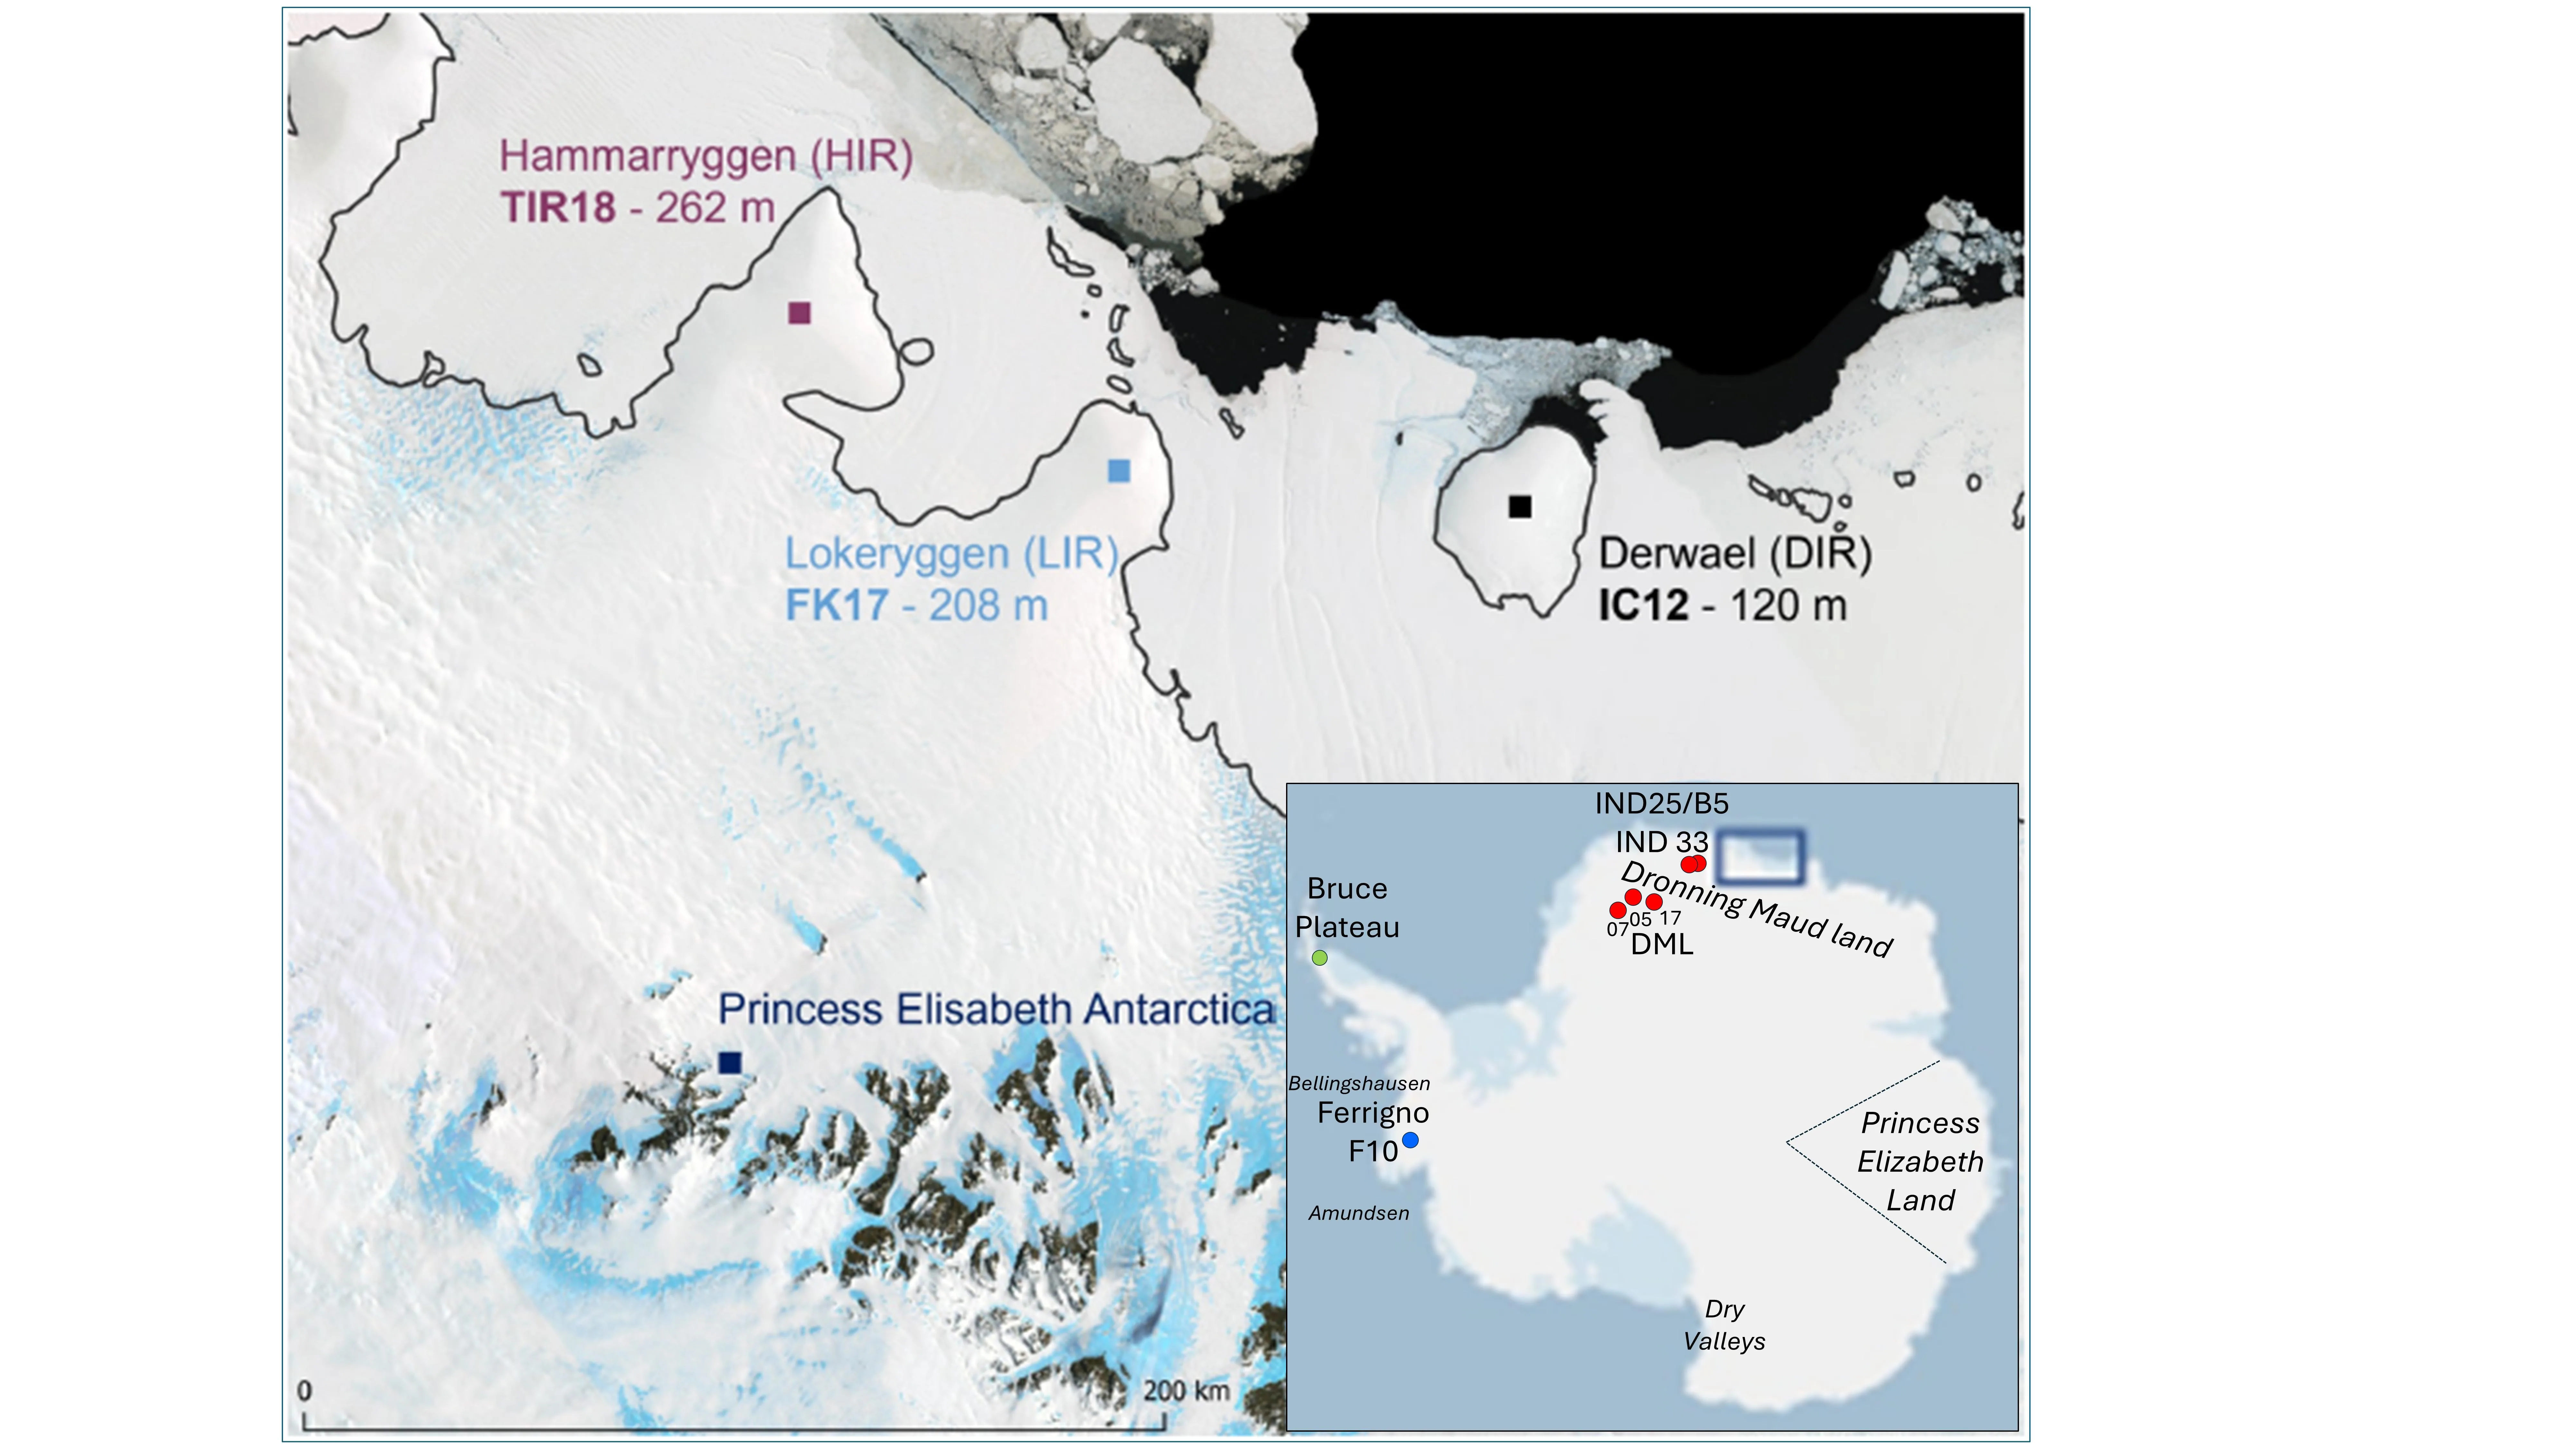
The researchers took two cores: FK17 (208 meters) and TIR18 (262 meters), drilled on the crests of the ice rises Lokerryggen and Hammarryggen. From the upper 120 meters of each core, they measured the oxygen isotope composition δ18O at 5-centimeter intervals using a PICARRO L 2130-i laser spectrometer. The time series were cleaned of seasonal cycles and high-frequency noise using singular spectrum analysis, retaining modes with periods from two to fifteen years. They then applied the Liang–Kleeman method, which estimates the rate of information transfer from climate indices to δ18O, based on changes in Shannon entropy and allowing cause to be distinguished from mere coincidence. The analysis included seven indices (SAM, Niño3.4, SOI, PDO, TPI, AMO, DMI) and sea ice extent in three sectors around the drilling sites.
Results
The spectra of the two cores diverged: FK17 showed sharp peaks at periods of 3, 4, 6, 8, and 10–12 years, while TIR18 had broader peaks at 3, 5, 7, and 22–28 years. Causal analysis showed that FK17 is significantly influenced by ENSO, PDO, SAM, DMI, and ice extent in the 0–20°E and 20–40°E sectors. At TIR18, the main influences were ENSO, PDO, DMI, AMO, and ice extent in the 20–40°E and 40–55°E sectors. For the first time in Dronning Maud Land cores, an influence of the Indian Ocean Dipole was detected, which is logical given TIR18's more easterly position. The influence of SAM appeared only at FK17 and only at short periods of 3–5 years, whereas ENSO acts at both sites in the 2–5 and 7–10 year ranges. Differences between sites are attributed to different air mass sources: TIR18 receives air from more easterly and continental directions.
Implications
This work joins studies linking Dronning Maud Land ice cores to large-scale climate dynamics, but differs in method: instead of correlations, it applies for the first time Liang's causal analysis, which shows the direction of influence. Neighboring studies sought links with ENSO and SAM through spectra and wavelets, while this paper adds the Indian Ocean Dipole and separates the influence of different sea ice sectors. This allows not just stating that rhythms coincide, but asserting that climate indices indeed drive the isotopic record, not the other way around.
Future development
The limitation of record length (1979–2010) prevents investigating periods longer than ten years, although traces of twenty-year and longer oscillations are visible in the cores. With longer climate indices becoming available, it will be possible to separate natural multidecadal modes from the anthropogenic trend. The method can easily be extended to other proxies from the same cores: deuterium excess, mass balance, non-sea-salt sulfates, and methanesulfonic acid, which show strong local contrasts. Also promising is the application of a nonlinear version of causal analysis, currently being tested on idealized models.
Impact
The results will affect the interpretation of paleoclimate records in coastal East Antarctica and reconstructions of past sea ice variability.
Next steps
Apply the same causal analysis to other proxies from the FK17 and TIR18 cores, as well as to longer climate series when they become available.
Key open problems
For climatology and glaciology, a key unresolved question is how to separate the contribution of natural low-frequency variability and anthropogenic warming in coastal Antarctic trends. This study shows that local isotopic records are driven by different combinations of climate modes, which must be accounted for when calibrating temperature proxies.
The knowledge machine's view
This section is addressed to the author of the paper and their colleagues. Neighbouring works were found by meaning-based search across our archive, not by word overlap. We do not review: we show the field around the work.
What the work does
The study applies the Liang–Kleeman method to two ice cores from Dronning Maud Land to uncover causal links between oxygen isotope composition and seven climate indices, as well as sea ice area in three sectors. Spectral analysis revealed differences in oscillation periods between the sites, and causal analysis showed that at FK17, ENSO, PDO, SAM, DMI, and ice area in the 0–20°E and 20–40°E sectors have significant influences, while at TIR18, ENSO, PDO, DMI, AMO, and ice area in the 20–40°E and 40–55°E sectors are significant. The authors attribute the differences to proximity to the ocean and air mass trajectories.
Where its strength is
The strength of the work lies in applying the Liang–Kleeman causal analysis, which allows assessing the direction of influence of climate indices on the isotope record, rather than just correlation. This provides a more robust basis for interpreting climate signals in ice cores.
Where it could go next
- It might be interesting to see how the Liang–Kleeman method works on other Antarctic ice cores, especially in regions with different climate dynamics, such as the Antarctic Peninsula or West Antarctica, where the influence of tropical modes may be stronger. Nearby in our archive is a study on how Antarctica responds to carbon dioxide, which could offer insights into separating anthropogenic signals from natural variability in isotope records.based on: Ice Has a Memory: How Antarctica Responds to Carbon Dioxide arXiv:2601.06986
- One could consider expanding the analysis to include solar and tidal cycles as potential external factors modulating climate indices and thus the isotope record. Our archive contains studies on solar cycles and solar tidal rhythms that might provide ideas on how such slow variations could manifest in ice core spectra.based on: Solar Cycles: How Magnetic Swings Sway the Future · The Sun's Tidal Rhythms arXiv:2602.16656 arXiv:2602.11227
Worth trying
- Apply the Liang–Kleeman method to longer cores to test the stability of the detected causal links over centennial timescales.
- Compare causal maps for different seasons to see how seasonality affects the transfer of information from climate modes to δ18O.
- Use an ensemble of climate models to check whether they reproduce the observed causal links, which could aid in interpreting paleoclimate reconstructions.
Why this may matter
If the Liang–Kleeman method proves robust across different cores, it could become a standard tool for paleoclimatologists, enabling them to separate causal signals from noise and better understand regional responses to global climate modes.
Nearby works in our archive
- Ice Has a Memory: How Antarctica Responds to Carbon Dioxidesimilarity 0.50
- Solar Cycles: How Magnetic Swings Sway the Futuresimilarity 0.46
- The Sun's Tidal Rhythmssimilarity 0.45
- Stellar Recipes for Planetssimilarity 0.45
- Mountains on Exoplanets Prevent Eternal Wintersimilarity 0.45
The archive is sparse around this work: the closest review is only 0.50, against a usual 0.64. It looks like few have drilled nearby.
The two cores were drilled just a hundred kilometers apart, yet their isotopic spectra differ more than those of some cores separated by thousands of kilometers. The reason is that air masses reaching TIR18 come from the east and carry a more continental signal, while those reaching FK17 come from the west, over the Weddell Sea.
Key numbers
- distance between cores: about 100 km
- core depths: 208 m (FK17) and 262 m (TIR18)
- length of analyzed series: 384 months (1979–2010)
- range of significant periods: 3–20 years
- reproducibility of δ18O measurements: 0.02 ‰