Weather vs. Climate: How to Tell Noise from Signal express
In winter, one part of town gets three times as much snow as the neighborhood next door. One year is a scorcher, the next is a cold snap. That's the whims of weather. But over decades, a different, slow shift emerges: winters, on average, get milder. Telling the two apart is the central challenge for climate scientists.
In a new study, researchers propose a way to count how much of the temperature or precipitation data is random fluctuation and how much is a persistent change. They use computer models run many times with slightly different starting conditions, producing a whole fan of possible climates. Then they compare the spread among these runs with the shift caused by an external forcing, such as rising carbon dioxide.
It turns out the new approach works more reliably than previous ones, even when the data are heavily "scattered" or contain rare extreme values. The key is that the ensemble must include at least forty simulation runs. As the forcing strengthens, the share of randomness drops, and this becomes especially clear.
Such a tool helps separate the wheat from the chaff: understanding what in climate projections is truly driven by human activity and what is just natural variability, like an unexpected May snowstorm.
Original abstract
as written by the authors arXiv:2608.14455v1
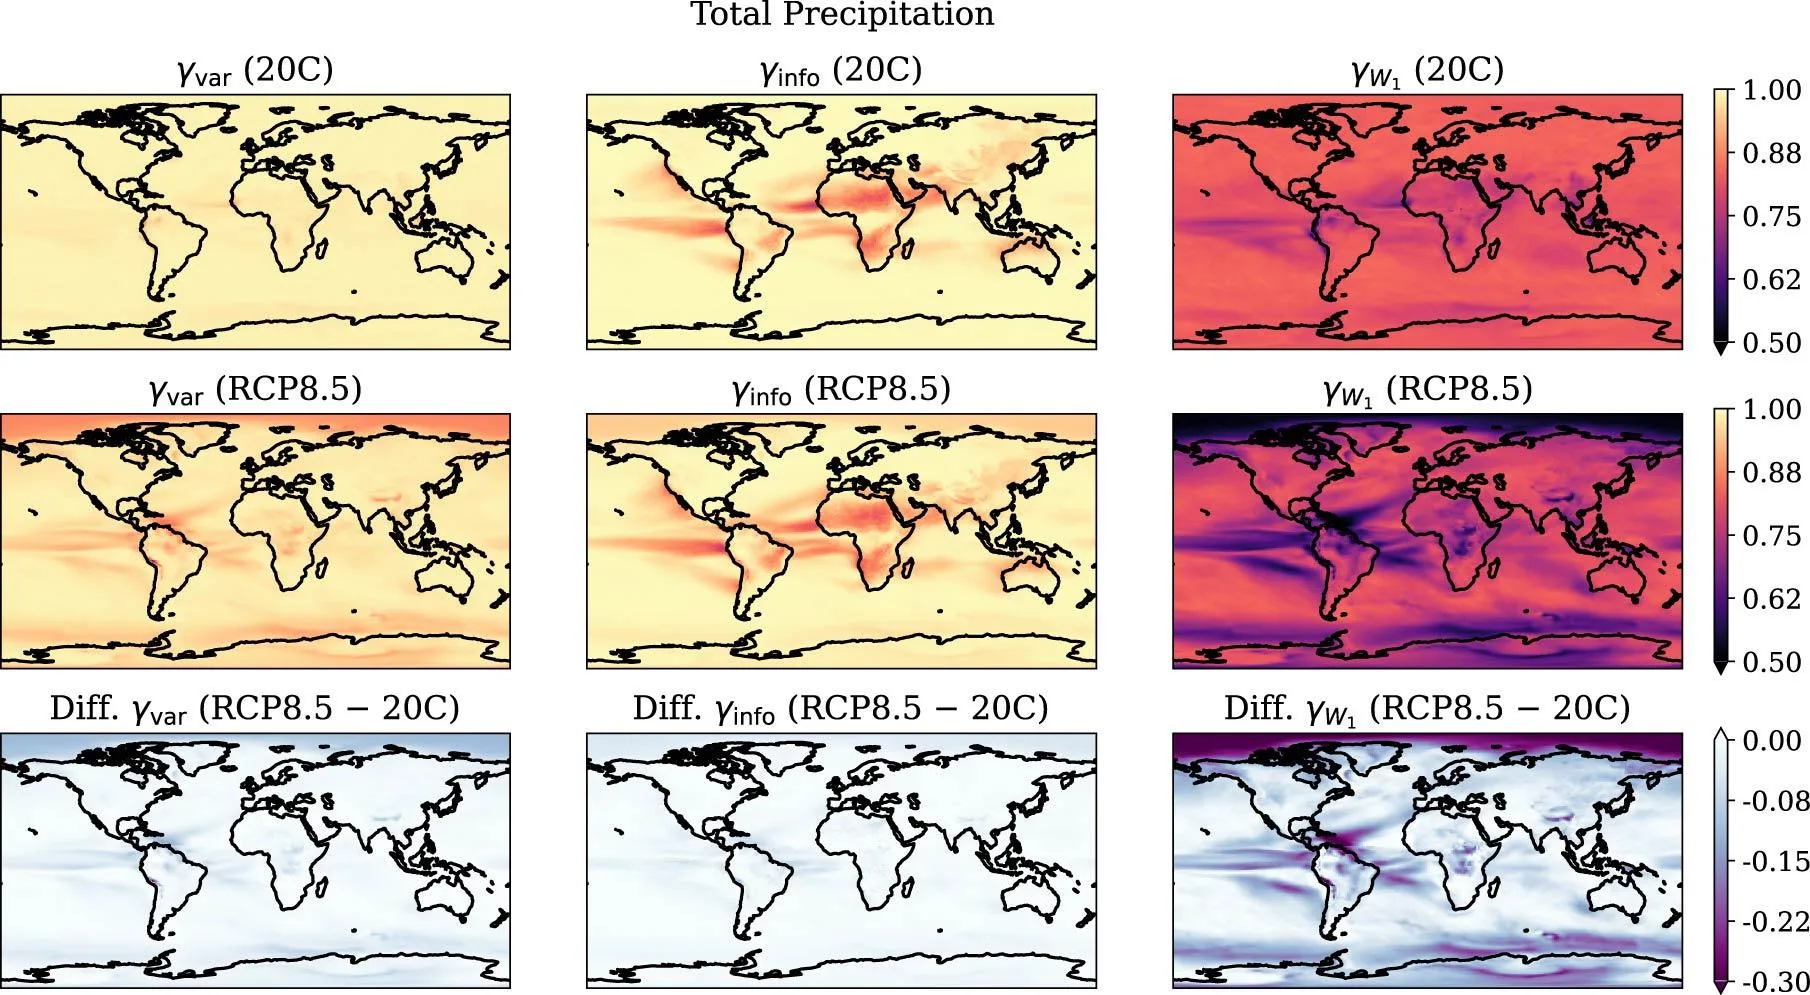
Quantifying forced and internal variability in climate data is fundamental to detecting the climate change signal and assessing uncertainty in climate projections. We propose a metric that quantifies the relative magnitude of internal variability in single-model initial-condition large ensembles (SMILEs). We measure forced and internal variability by two 1-Wasserstein distances, a form of optimal transport cost. The proposed metric is the distance for internal variability divided by the sum of the two. Computing this ratio requires only sorting the samples and differencing the resulting quantiles, with no additional parameters. The metric reflects the entire distribution shape and applies to non-Gaussian variables, because the 1-Wasserstein distance quantifies the difference between any two probability distributions. We validate the metric with synthetic climate data from Gaussian, uniform, and lognormal distributions. Unlike the two existing metrics, the proposed metric gives stable estimates irrespective of the distribution shape and the presence of outliers, provided that the ensemble has about 40 members or more. We then apply the proposed and existing metrics to the 2 m air temperature and total precipitation of the Community Earth System Model Large Ensemble (CESM-LE) under two different forcing scenarios. All the metrics indicate that the relative contribution of internal variability decreases as the forcing increases, but the proposed metric shows this response most clearly. The 1-Wasserstein distance thus provides a simple and useful tool for analyzing large-ensemble datasets.
In one modeling scenario, the warming was so strong that random temperature fluctuations almost stopped influencing the overall picture, the climate change signal became obvious.