A mode of variability is a recurring, organized pattern of change in a climate system that stands out from random fluctuations. Think of it as a 'favorite dance' the atmosphere and ocean perform together—not a single event, but a repeating rhythm that shifts temperatures, winds, and rainfall across large regions. These modes explain why some years are warmer or wetter than others in specific places, even when the overall global trend is steady.
History
The concept grew out of early 20th-century efforts to understand regional climate, with the discovery of the Southern Oscillation in the 1920s and the North Atlantic Oscillation in the 1930s. Statistical methods like empirical orthogonal functions, developed in the mid-20th century, formalized the identification of such modes.
How it works
Climate data, such as sea-surface temperatures or pressure fields, are analyzed statistically to find patterns that appear again and again. Each mode is characterized by a spatial pattern—where the anomalies are strong or weak—and a time series that shows when it is active. Physically, these modes arise from interactions between the ocean and atmosphere, such as how warm ocean water alters winds, which in turn change ocean currents, creating a feedback loop that sustains the pattern for months or years.
In practice
Modes of variability are used to make seasonal forecasts, since knowing the state of a mode like El Niño helps predict temperature and precipitation anomalies months ahead.
Fun fact
The El Niño–Southern Oscillation, the most famous mode of variability, shifts weather patterns across more than half the globe, from droughts in Australia to floods in South America.
In winter, one part of town gets three times as much snow as the neighborhood next door. One year is a scorcher, the next is a cold snap. That's the whims of weather. But over decades, a different, slow shift emerges: winters, on average, get milder. Telling the two apart is the central challenge for climate scientists.
A superfluid gas is like a crowd of people marching in step: each atom knows where to go and doesn't fall out of the common rhythm. But this crowd has three 'valleys'—three different directions it can take. In a new experiment, physicists made one valley slightly more 'favorable' than the others and watched how the crowd darted between them.
A sunspot, a dark island on the fiery surface, lives its own turbulent life. Beneath it, in invisible depths, giant magnetic loops drift like twisted cables. When such a loop emerges, it can discharge as a flare, and hurl clouds of charged particles into space.
Scientists have long tried to understand what determines the strength and suddenness of these events.
A protein chain folds into a working tool in a fraction of a second, and almost never makes a mistake. For a long time, it was thought that evolution specifically polishes amino acid sequences so that a protein not only works but also easily finds its unique shape. New work turns this idea on its head.
An ocean current hundreds of kilometers wide lives its own life, fed by energy from tiny eddies. Something similar happens in the atmosphere: small swirls pass their power on to huge air currents. This process, the inverse energy cascade, has been known for a long time.
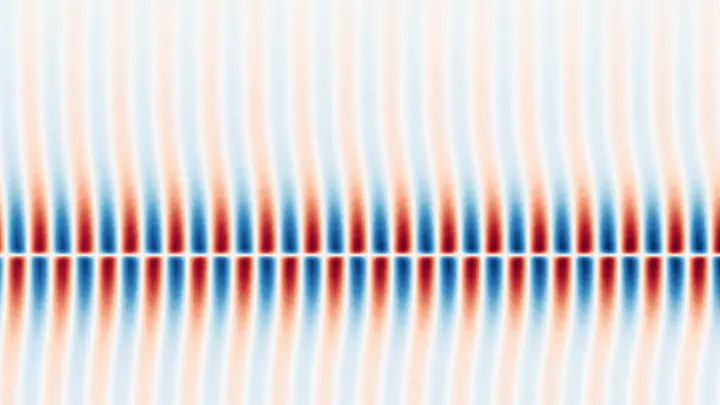
A lone fold runs across a taut sheet — a sharp drop in height that doesn't spread out but moves as a whole. Physicists call such a fold a 'kink'. If you give the sheet a sharp tug in one spot, ripples will travel across it. But in some media, these ripples don't disperse; instead, they gather into a clump and tremble in place for dozens or hundreds of cycles. Such a clump is an oscillon.
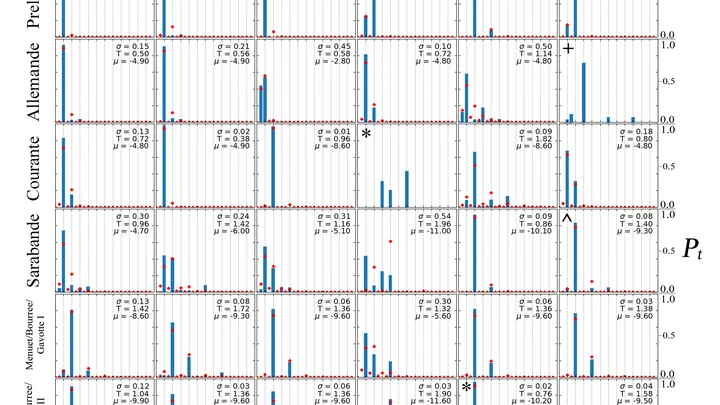
Music relies on repetition: we expect the beat to return, like a chorus coming back. But if you repeat the same thing for too long, it gets boring. The composer seems to walk a tightrope between the familiar and the unexpected.
Scientists translated this balance into the language of physics.
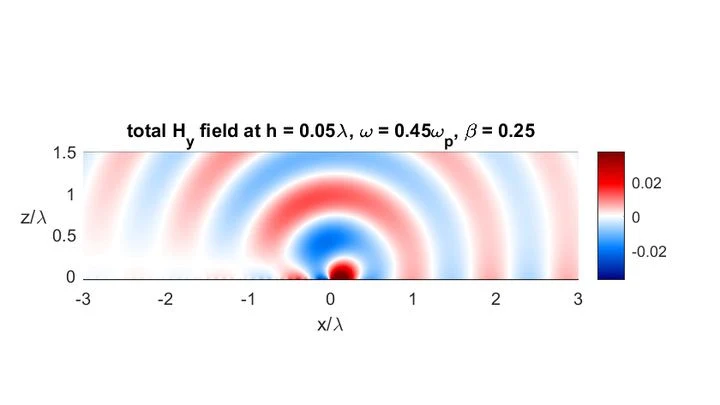
A swimmer cutting through water at the speed of the waves running on it finds themselves in a strange position: the waves they themselves generate can neither overtake them nor fall behind. They pile up at the swimmer's bow and freeze. A similar phenomenon occurs when a light source moves inside a medium at a speed matching the speed of energy transfer of the waves.
In two neighboring ponds, the same microorganisms swim. Food appears now in one, now in the other — randomly, with no rule. After a month, there are a hundred times more of them in the first pond than in the second. No one chose where to live. Just luck.
This is how disequilibrium works. While the environment keeps changing, abundances don't have time to even out.
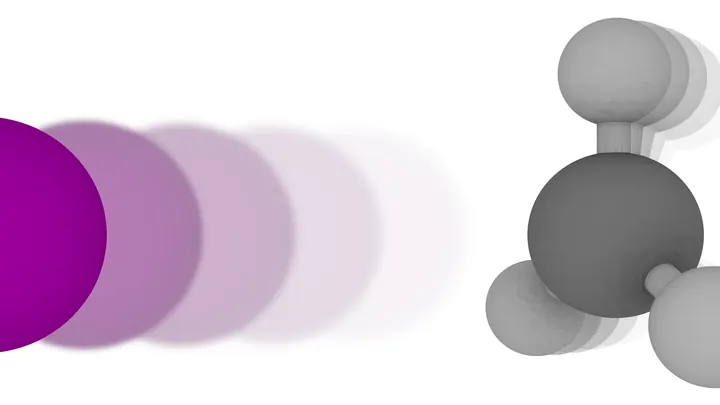
A chemical bond is like a stretched spring between atoms. When it's snapped, the molecular fragments fly apart, but they don't freeze: they keep vibrating, like a plucked string. That's exactly the vibration a team of researchers caught when they broke a methyl iodide molecule with an ultraviolet laser.
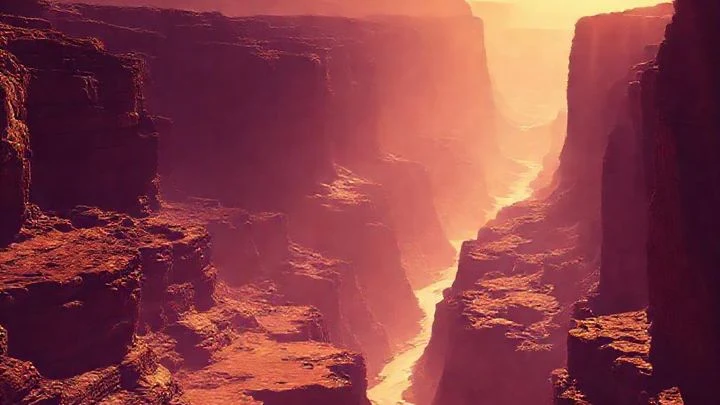
For a long time, the climate of ancient Mars remained a mystery: the beds of dried-up rivers spoke of water, but models couldn't explain how it got there — after all, 4 billion years ago the Sun shone 30% dimmer. New research shows that the planet swayed, as if on a swing, between long glaciations and short wet epochs.
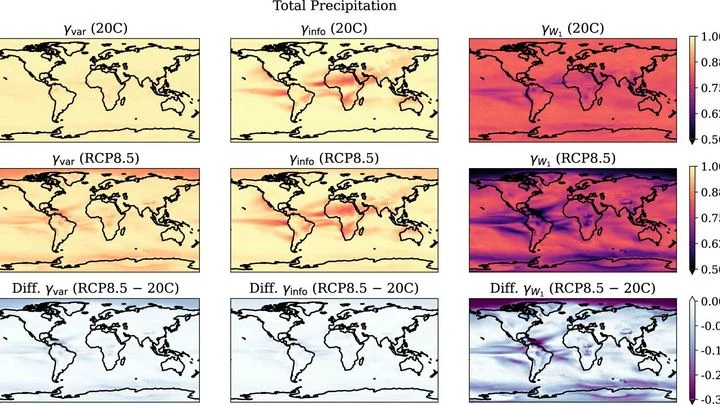
Rain doesn't fall just any old way. If you take records from nearly fifty thousand rain gauges scattered across the globe and compare how much water falls on a rainy day in different parts of the planet, you'll spot a surprising pattern.
A thin thread in a water flow is like a hair in a shower stream. If you jerk the water back and forth, the hair either stretches out with the flow or crumples up. The researchers took real protein threads (actin, which makes up muscles) and placed them in a microscopic channel where the fluid oscillated at different frequencies.
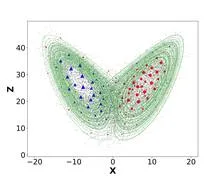
In winter, air over the Northern Hemisphere does not move haphazardly; it spends days at a time in the same pattern before rearranging itself. These patterns are like rooms in a maze: the system enters, lingers, then finds a door to another room. Each room has its own weather: somewhere over Europe it is warm and humid, while over Siberia it is frosty and clear.
Seventy-five years of weather observations in India, when plotted on a graph, resemble the cardiogram of a vast organism. Instead of a single steady pulse, there are fifteen different lines, each with its own rhythm. Somewhere the heartbeat is as steady as a sleeping person's, while elsewhere it falters, as if after a quick run.
Every summer, a giant atmospheric engine unfolds over India: moist ocean winds bring the rains that sustain crops and the lives of two billion people. But this engine sputters, and forecasting it a season ahead remains elusive. Models give only rough answers, and a monsoon forecast error can cost millions of tons of food.
The ocean remembers its past. Heat given to the water off the coast of Norway does not vanish without a trace: it embarks on a long journey across the Atlantic, only to return decades later and alter the temperature at those same shores once again.
The speedometer needle in a car shows how fast the wheels are spinning. The climate system also has rotation, but it is invisible: it happens in state space, where each point is a combination of ocean temperature, the depth of the warm layer, and other parameters.