A Linear Inverse Model (LIM) is a statistical tool used to describe and predict the behavior of complex systems, such as the climate, by assuming that the relationships between the system's key variables are linear. In essence, it treats the system's state as a set of numbers (like temperature, pressure, or ocean heat content) and models how those numbers evolve over time using a simple linear equation. Despite the complexity of the underlying physics, many large-scale climate phenomena can be approximated surprisingly well by such linear dynamics, making LIMs a powerful and efficient baseline for forecasting.
History
The Linear Inverse Model approach was formalized in the 1990s, particularly by climate scientists like Cecile Penland and colleagues, who applied it to tropical Pacific sea surface temperatures to forecast El Niño events.
How it works
The LIM is built from historical data. First, researchers define a state vector that captures the essential variables of the system—for example, sea surface temperatures and sea level pressures across the Pacific. Then, they analyze the data to estimate two key components: a linear operator that describes how the current state influences the future state (the 'dynamics'), and a noise term that represents unpredictable, random fluctuations. The linear operator is derived from the covariance structure of the data, essentially finding the best linear fit to the observed time evolution. Once constructed, the LIM can be used to project the state forward in time, providing forecasts. It also allows for the analysis of the system's intrinsic modes of variability, such as the El Niño–Southern Oscillation, by examining the eigenvectors of the linear operator.
In practice
LIMs are used for operational seasonal climate forecasts, particularly for predicting El Niño and La Niña events, and serve as a benchmark against which more complex dynamical models are compared.
Fun fact
Despite its simplicity, a LIM built from just a few decades of data can often outperform sophisticated general circulation models for certain climate predictions, such as tropical Pacific sea surface temperatures, over lead times of several months.
Picture a wind map over a mountain range. The wind mostly blows downhill, following elevation changes. But if you look closely, in some valleys the air swirls into little eddies that keep the wind from simply flowing down. That is exactly what the mutation field in human DNA looks like.
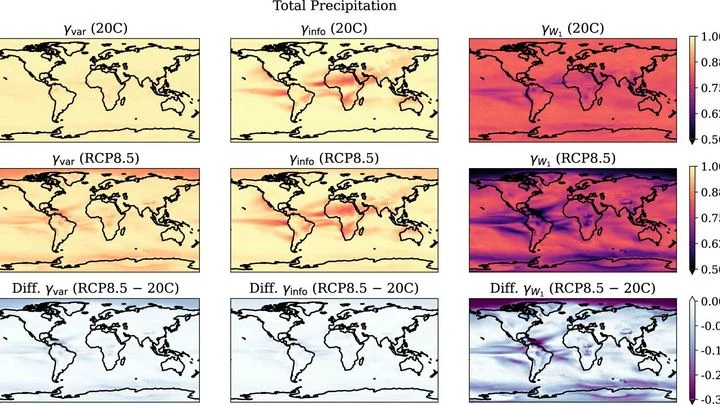
In winter, one part of town gets three times as much snow as the neighborhood next door. One year is a scorcher, the next is a cold snap. That's the whims of weather. But over decades, a different, slow shift emerges: winters, on average, get milder. Telling the two apart is the central challenge for climate scientists.
In an oven, as temperature rises, molecules move faster and disorder increases. With language models like ChatGPT, it's the opposite. When developers increase the 'temperature' parameter, the model gets access to a wider choice of words, but its long texts suddenly start looping.
A team of researchers tested 11 different AIs by generating 12,000 text continuations.
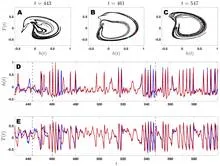
A Dictyostelium amoeba crawls across glass. Its path is recorded — a chain of points on a plane. But what forces are pushing it? Inside the cell, a molecular motor works: proteins pull, the membrane springs, water presses.
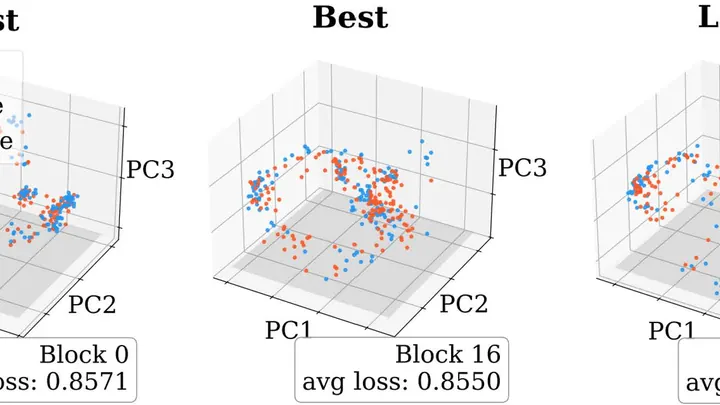
A twitch of the robot's camera and it drops the part: its neural network is thrown off. But if you peek at its signals, they resemble constellations in a galaxy: when things go smoothly, they cluster in one sector, and just before an error, they abruptly shift to another. The boundary between them is as clear as a safe channel through reefs.
Unlike regular cameras, event-based ones only record moments when light becomes brighter or dimmer. They don't produce snapshots; instead, they send an endless stream of such flashes. Scientists turned this stream into a sharp picture of the Earth while flying over it on a satellite. Each flash is like a piece of a mosaic; together they form a still image.
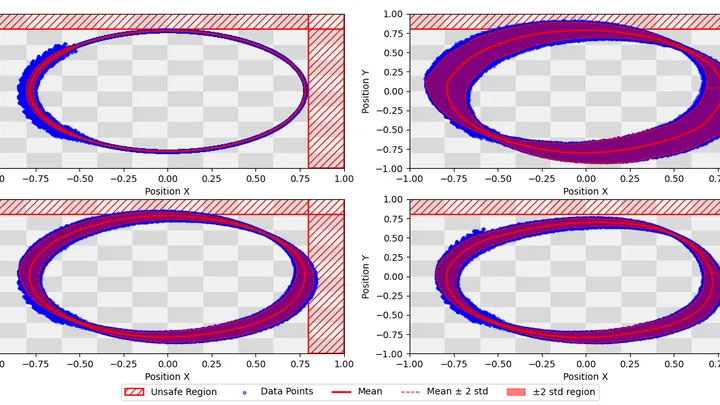
When an unmanned aerial vehicle learns from an experienced pilot, it memorizes not individual maneuvers but entire safe corridors — the trajectories along which the human mentor moved. This approach is called imitation learning: the machine mimics expert demonstrations.
In a soup pot, you only need two thermometers to gauge the temperature everywhere — if you know heat travels in circles from the bottom. Science works the same way: from a handful of measurements, you want to reconstruct the full heat picture.
The system captures the gist of heat flow, compressing it into a handful of governing numbers.
Complex machinery, from drones to surgical robots, sometimes behaves like a wild mustang: full of disorder and whims, where the slightest touch triggers a storm. Instead of rote memorization of formulas, the new method observes the system like a horse breaker.
A false vacuum is not just a supercooled liquid, but a quantum hologram, ready to spring to life under the right projection. Its decay is described by the tunneling of a quantum field from a metastable minimum, and the classic calculation via Euclidean instantons is as elegant as a still life under spotlights.
A student who has spent years solving problems from other people's textbooks suddenly receives three notebooks with real ocean observations. There are few problems, but they have already seen hundreds of similar ones, and now a couple of examples suffice to catch the new teacher's style.
A chef doesn't waste ingredients cooking the whole dish to check the taste: they just taste a drop of sauce. The same logic underlies the "information matching" method for predicting metal strength. Instead of expensive calculations of every atom's behavior, scientists "taste" only simple indicators linked to plasticity — a metal's ability to bend without breaking.
Two ultra-dense stars spiral around each other and eventually collide. This dance lasts only moments, but it sends powerful ripples through space — gravitational waves. After the merger, a rapidly spinning blob remains, ringing like a bell, and that ring carries information about what the stars were made of.
A library of 27,000 books, and every one of them is about concrete. Each contains a mix recipe, temperature, and strength. But the information is scattered across paragraphs, tables, and footnotes. For a human, gathering it all together would take years. The program did it in an hour.
Hot tea cools down, and its temperature is the same throughout the cup. But in many systems (for example, in the rarefied gas between stars or in plasma) temperature is not uniform: in one place particles are faster, in another slower. Physicists call such systems "superstatistical": it's as if the tea consisted of many small regions, each with its own temperature.
Heat flows through matter like water through pipes: sometimes fast, sometimes barely. Engineers seek materials that almost don't let heat pass — like clogged pipes. Such insulators are vital for energy saving and devices that turn heat into electricity. The neural network KappaFormer quickly evaluates the "throughput" of an atomic structure.
There's no tool to measure distances to faraway galaxies, but nature left a clue: after the Big Bang, sound waves created rhythmic clumps of matter. Today, this is noticeable as a slight preference for galaxies to be at a certain distance from each other — a built-in ruler.
The Social Laser theory describes society by borrowing the inner workings of a laser. People, like atoms in a crystal, absorb streams of information and become charged by it. When the number of those charged with a single idea outweighs the indifferent, even a weak signal (a post, a call to action) makes everyone act as one.
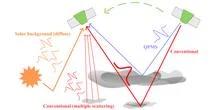
Ice clouds can masquerade as water clouds. A satellite lidar sends a short laser pulse downward and catches the reflection. If flat ice plates hang horizontally in the cloud, they act like tiny mirrors: light bounces back almost without loss. To the instrument, such a flash looks just like a reflection from water droplets.
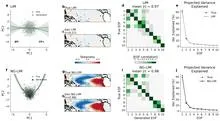
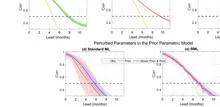
Glasses with flat lenses show a symmetric world: rise and fall, heat and cold look the same. For decades, climatologists have viewed El Niño through such glasses, using linear inverse models. These captured the rhythm of oscillations but missed that the warm phase of El Niño is typically sharper and stronger than the cold La Niña.
An interpreter at negotiations hears only the words already spoken, yet still guesses the next phrase. This is how the new El Niño forecasting method works: it doesn't peek into the future but relies solely on the past, like an honest listener.
The orchestra plays the symphony of climate. Each violin, each wind instrument carries its own part: these are the Kolmogorov modes, the system's natural rhythms. Suddenly, a thunderclap bursts into the hall: a sharp jump, like a gust of wind or a downpour. Previously, we could only listen to the smooth sound, but we couldn't decipher such chords.
In the new work, mathematicians have completed the score.
Ocean currents intertwine like sticky spider silk: every disturbance leaves a trace that does not vanish instantly. Climatologists have been used to treating random jolts in this web as invisible and memoryless, but new research shows that noise has memory, and that memory strengthens connections between distant nodes.
Every winter, the Pacific Ocean warms slightly off the coast of Peru, and every summer it cools. This rhythm is set by the gears of the climate machine, but some turn fast, others slow, and still others speed up or stall. Linear inverse models have helped us glimpse these gears in data for decades, but they were blind to seasonal changes in pace.
Climate is like an orchestra without a conductor: each musician hears the others with a delay, and the score changes mid-concert. The ocean, atmosphere, ice, and land continuously exchange energy, and the slightest hiccup in one instrument can escalate into a shift of the entire melody.
A translator in a conference room hears not only the words but also the echo of previous phrases still bouncing around the ceiling. If they get distracted by every reverberation, an hour of conversation turns into two. Similarly, a complex system, whether an ocean or a power grid, receives random jolts that do not vanish instantly but drag behind them a tail of memory.
Setting up an orchestra without a conductor: the algorithm itself decides which instruments (basis functions) and at what volume (weights) should play to reproduce Earth's gravitational symphony.
A fisherman in Queensland notices that in some years snapper are harder to catch, even though the nets and boat are the same. The reason hides not in the catch itself but in the water temperature several months earlier, when the fry were just hatching. A warm current arrived not for the whole year but only for a few weeks, and that short episode decided the fate of an entire fish generation.
An interpreter at an important negotiation keeps a draft of their speech at hand but checks against the live conversation as they go: if what is said diverges from the prepared text, they adjust the translation on the fly.
Winning the lottery changes the winner's life, but for the statistics of all players it means almost nothing: the probability of winning is negligible, and the average winnings per ticket remain tiny.
The ice cover of a river looks solid, but beneath it lie cracks that alter the flow. So it is with a time series: behind the smooth surface of numbers hide moments when the rules of the game change. These moments are called change points, and finding them is like tapping the ice to locate weak spots.
A translator learns not from a dictionary but from speech. They listen to native speakers and pick up rules that are written in no textbook. Similarly, a new method for forecasting complex systems such as climate or turbulence does not require knowing their equations. Instead, it looks at data and learns to predict their behavior.