Extreme Madden–Julian Oscillation Events ✛
Context
The Madden–Julian Oscillation (MJO) is the main source of tropical variability on 30–60 day timescales. It moves eastward, alternating regions of strong convection and suppressed rainfall, and through atmospheric bridges it affects monsoons and rainfall far beyond the tropics. In South America, the MJO drives a precipitation dipole: when rains intensify in one part of the continent, they weaken in another. However, most MJO events are weak and quickly decay; only rare extreme episodes can travel the full circumference of the globe. This work puts such events in the spotlight: it separates them from weak ones using a statistical threshold and shows that they carry the strongest disturbances into South America. Nearby in the archive are studies of stellar flares, neutrino oscillations, and X-ray emission from hot matter, all examining rare but powerful events, but here the focus shifts to Earth's atmospheric dynamics.
Methods
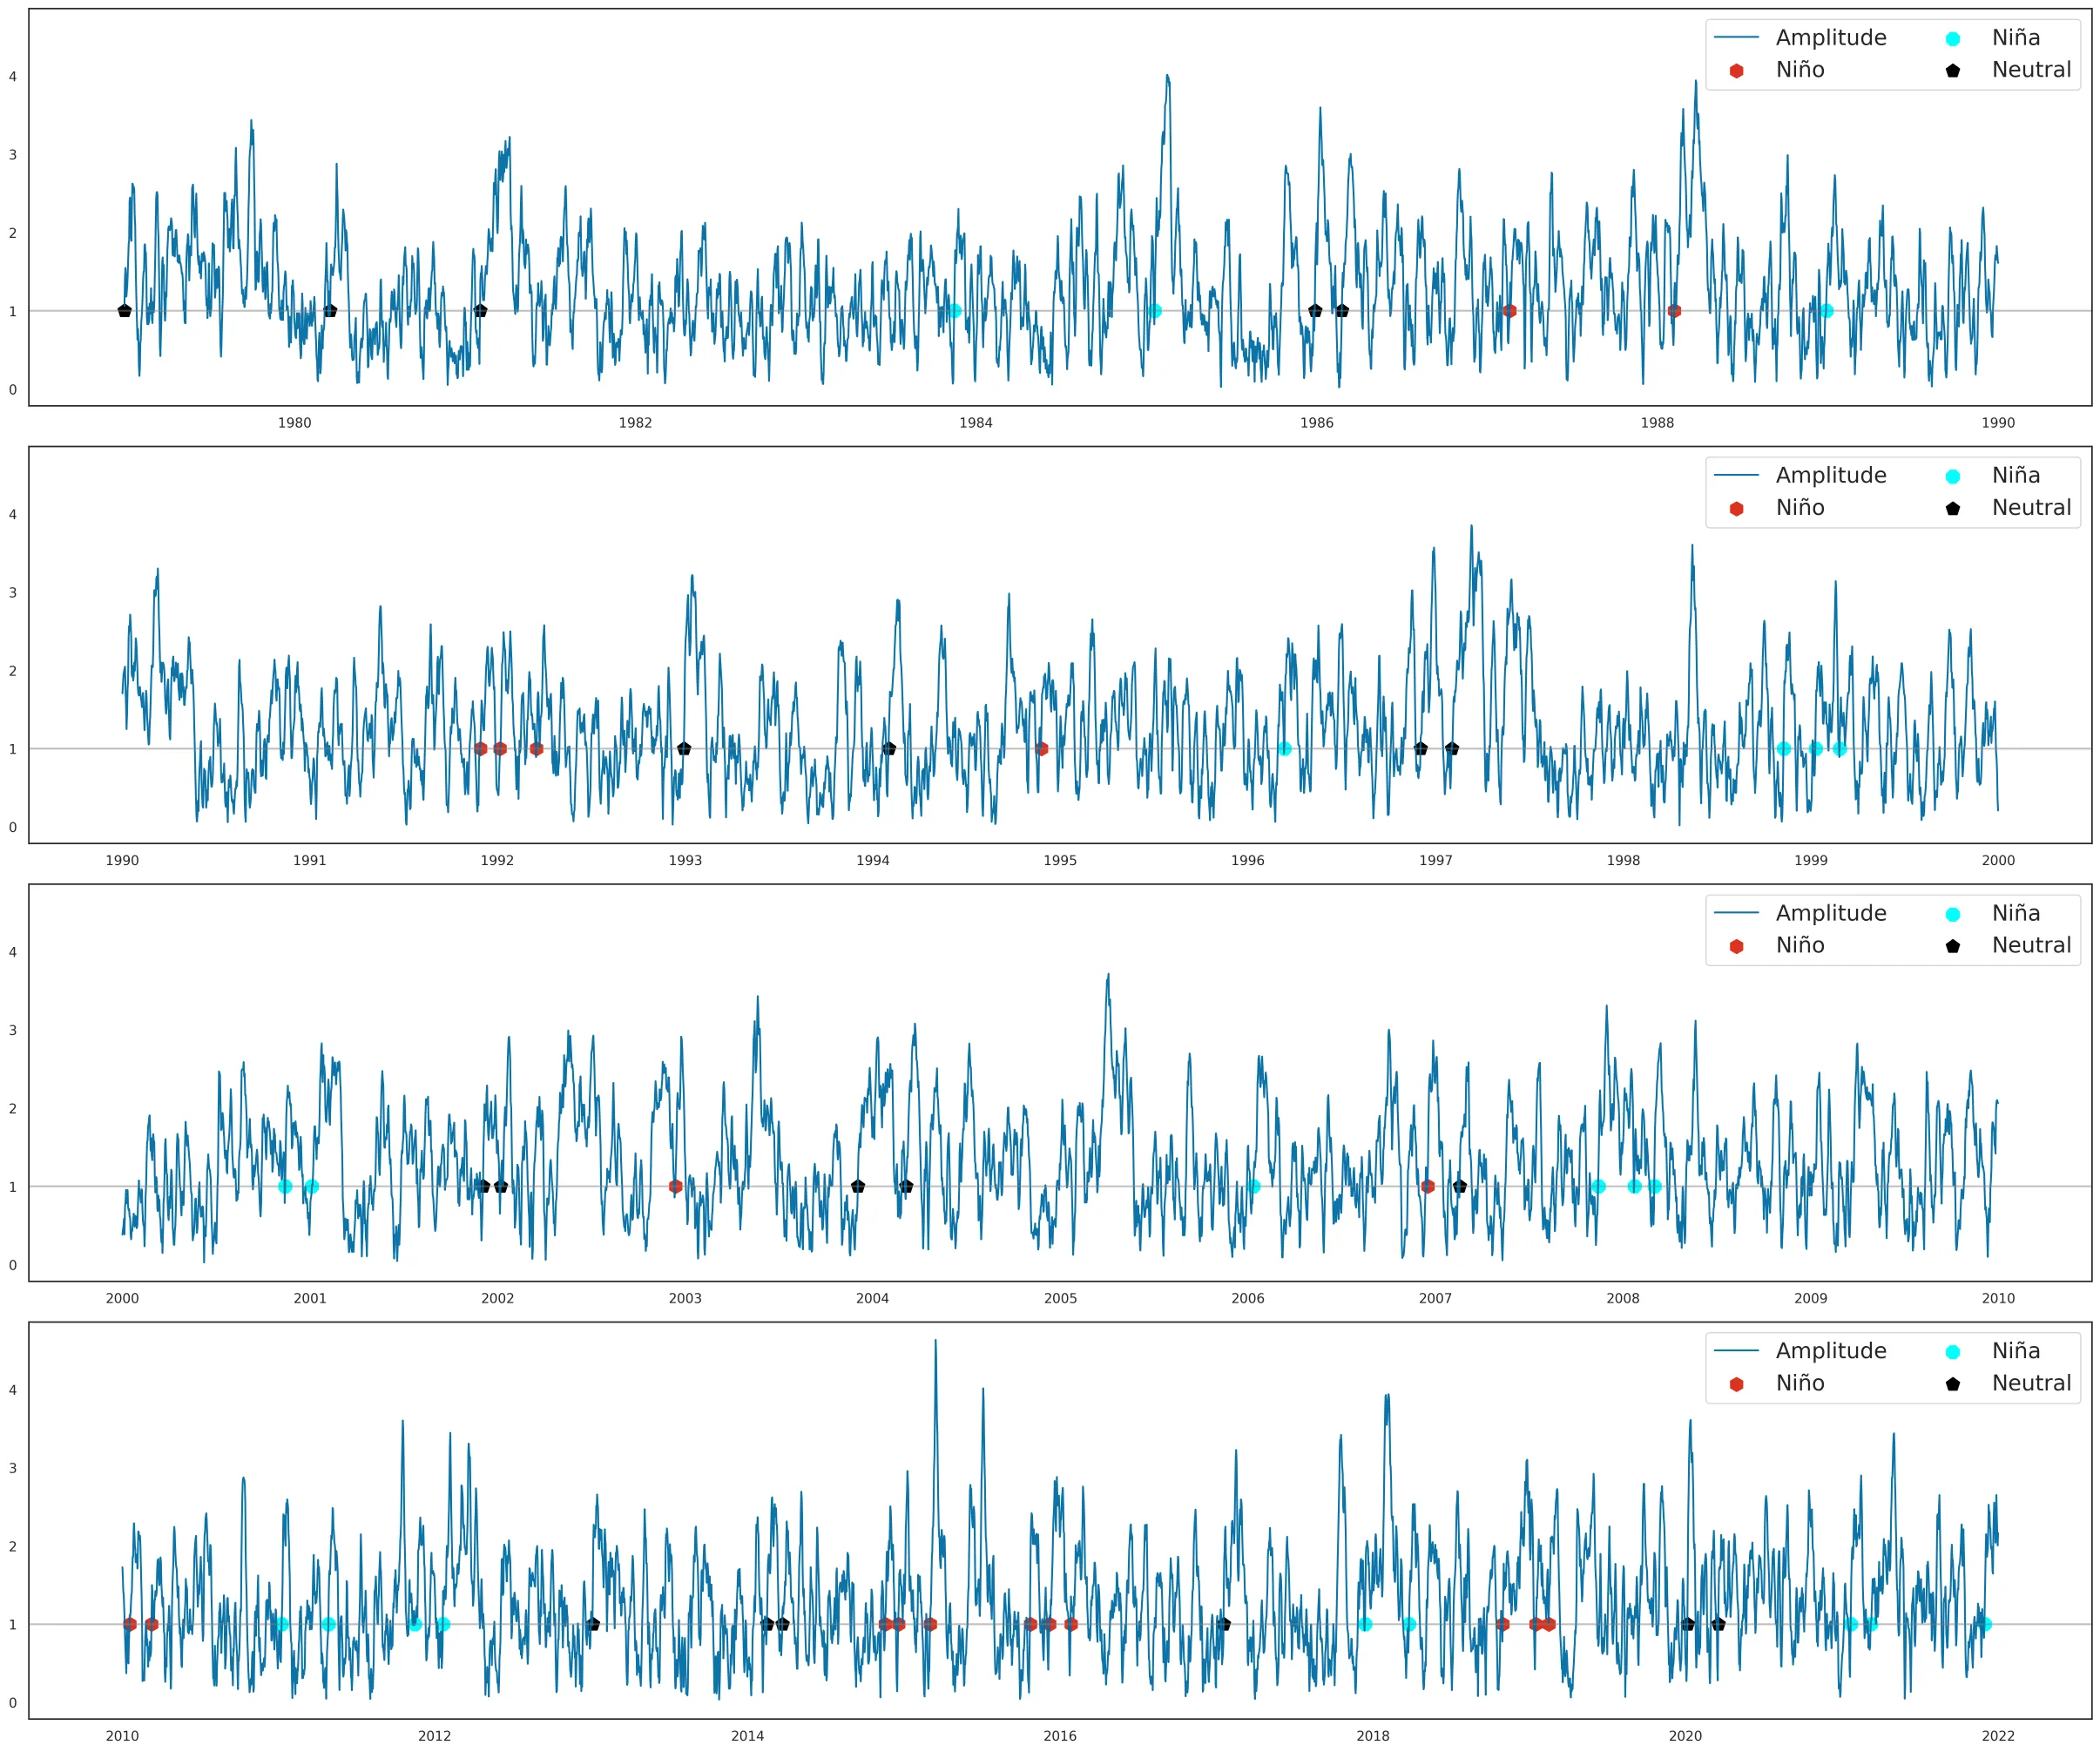
The authors used the RMM (Real-time Multivariate MJO) index, which is constructed from outgoing longwave radiation and zonal winds at two levels. An MJO event was defined as a continuous period when the index amplitude exceeded one. For each event, they computed duration (in days) and size (the sum of amplitudes over the lifetime). Then a power law was fitted to the tails of the distributions of these quantities, allowing them to find a threshold: events with a size of 39 or more were considered extreme, the rest weak. To analyze the impact on South America, composite maps of anomalies of outgoing longwave radiation, eddy streamfunction, and velocity potential at 200 hPa were constructed. Events were grouped by onset phase (phase pairs 8-1, 2-3, 4-5, 6-7) and by El Niño phase (El Niño, La Niña, neutral). Statistical significance was assessed with a t-test at the 10% level.
Results
A total of 132 extreme MJO events were identified over 1979–2021, of which 61 occurred during the extended austral summer. Extreme events most often start in phases 2–3 (over the Indian Ocean) throughout the year, but in summer initiation is nearly evenly split between phases 2–3 and 8–1. Weak events, by contrast, more often start in phases 4–5. Extreme events that begin in phases 2–3 last longer and have larger size than those starting in phases 8–1. More than 68% of extreme events that reach phases 4–5 cross the Maritime Continent barrier, whereas among weak events more than half decay before that. Composite analysis showed that precipitation anomalies during extreme events are more intense and cover a larger area than during weak events. The South American precipitation dipole (SAD) is more pronounced and persists longer during extreme events, especially if they started in phases 2–3. During La Niña, extreme events last on average 40 days versus 35 during El Niño, whereas for weak events there is no such difference.
Implications
This work contributes to understanding rare but most influential MJO events. Unlike neighboring studies that consider the MJO as a whole or individual aspects of its connection with El Niño, here extreme events are systematically identified for the first time using a power-law tail of the size distribution, and their evolution is traced as a function of onset phase and El Niño state. This allows separating predictable signals from noise: if an MJO starts in a certain phase and has a large size, its impact on South American rainfall can be foreseen several weeks ahead. Such an approach strengthens existing subseasonal forecasting methods, which usually rely on average MJO characteristics.
Future development
The topic could evolve toward operational monitoring of MJO size and onset phase in real time. If forecasting centers begin tracking not only amplitude but also accumulated event size, they could identify extreme episodes in advance and provide more confident rainfall forecasts for South America. Another path is studying the feedback: how extreme MJOs themselves influence El Niño development through westerly wind bursts. It is also promising to test whether the found patterns hold in longer data records and in other regions, such as Africa or Southeast Asia.
Impact
The results are directly useful for rainfall forecasting in South America on timescales from two weeks to two months, which is important for agriculture, water resource management, and flood warning. Furthermore, accounting for extreme MJOs could improve climate models, which currently often underestimate rare strong events.
Next steps
The next step could be testing the predictive power of extreme MJOs on independent data and in other seasons. It is also worth investigating how extreme events interact with other modes of variability, such as the Antarctic Oscillation, and how that affects South American rainfall.
Key open problems
This work touches on a fundamental problem in meteorology: why some MJO events decay while others intensify and complete the full cycle. This is related to the unresolved question of the role of the Maritime Continent as a barrier to MJO propagation. In addition, the question remains open as to how exactly El Niño modulates the MJO: through changes in the background state or through direct interaction of convective anomalies. This study provides an observational basis for testing hypotheses, but does not answer them definitively.
The knowledge machine's view
This section is addressed to the author of the paper and their colleagues. Neighbouring works were found by meaning-based search across our archive, not by word overlap. We do not review: we show the field around the work.
What the work does
The study identifies extreme MJO events using a statistical size threshold (39), compares them with weak events, and accounts for the El Niño phase. It shows that extreme events more often start in phases 2–3, last longer during La Niña, and produce more intense and widespread precipitation anomalies in South America, especially in the form of a dipole.
Where its strength is
The strength lies in the systematic identification of rare but most influential MJO events and in demonstrating their particular role in teleconnections with South America, which paves the way for improving subseasonal precipitation forecasts.
Where it could go next
- It might be interesting to see how extreme MJO events interact with other modes of variability, such as the quasi-biennial oscillation or the Antarctic Oscillation, which may modulate their propagation and influence on South America. Nearby in the archive there is a paper on solar tidal rhythms that analyzes complex periodicity, which may suggest methods for joint analysis of multiple cycles.based on: The Sun's Tidal Rhythms arXiv:2602.11227
- One could consider the connection between extreme MJO events and sea surface temperature anomalies in individual ocean basins beyond El Niño, for example, the Indian Ocean Dipole. The archive contains a study of the tidal seesaw of the eccentric Jupiter, which shows how gravitational influences shape long-period variations, which could be an analogy for seeking external factors that affect MJO intensity.based on: Tidal Swings of an Eccentric Jupiter arXiv:2607.16406v1
- Attention could be paid to extreme events in other atmospheric phenomena, such as thunderstorm activity, to borrow methods for identifying rare events. The archive has a paper on a thunderstorm seen in muons, which uses detection of rare signals against background noise, which may be useful for refining MJO extremity thresholds.based on: The Storm You Can See in Muons arXiv:2603.26112
Worth trying
- Test whether the identified relationship between extreme MJO events and the South American precipitation dipole holds when using alternative MJO indices, for example, those based solely on OLR.
- Assess the predictability of extreme MJO events based on their initial phase and El Niño state using simple statistical models.
- Compare composite anomalies for extreme events that started in different phases, accounting for their different durations, to separate the effect of size from the effect of phase.
Nearby works in our archive
- The Sun's Tidal Rhythmssimilarity 0.49
- Tidal Swings of an Eccentric Jupitersimilarity 0.49
- Death of a Planet: A Bright Flare from Its Parent Starsimilarity 0.48
- The Storm You Can See in Muonssimilarity 0.47
- Dust Storms on a Rogue Planetsimilarity 0.47
- The Sun's Pulse in Interstellar Silencesimilarity 0.47
The archive is sparse around this work: the closest review is only 0.49, against a usual 0.64. It looks like few have drilled nearby.
An extreme MJO event starting in phases 2–3 can pass through five consecutive phases before decaying, whereas a weak event often dies after just one or two phases. The longest extreme event in the sample lasted 32 days, comparable to a full MJO circuit around the globe.
Key numbers
- size threshold for extreme events: 39 (dimensionless sum of amplitudes)
- duration threshold for extreme events: 24 days
- number of extreme events over 43 years: 132
- average duration of extreme events during La Niña: 40 days
- average duration of extreme events during El Niño: 35 days