Climate in the Price of a Bond: How Machine Learning Predicts Catastrophe Bond Coupons ✛
Context
Catastrophe bonds emerged in the 1990s after a series of devastating hurricanes and have since grown into a market worth tens of billions of dollars. They allow insurers to offload part of the risk of extreme losses onto investors, who earn attractive coupons as long as a specified disaster does not occur. Traditional pricing models rely on expected losses, trigger type, and market indicators, but climate dynamics remain poorly accounted for. This work stands apart from neighboring studies: nearby are forecasts of solar flares, training neural networks on quantum chemistry errors, and climate models, but none of them linked climate indices to catastrophe bond coupons through machine learning.
Methods
The authors collected 734 primary market tranches from June 1997 to December 2020 with features such as expected losses, attachment point, term, trigger type, and region. To this they added eight climate indicators: the El Niño index (ONI), Arctic Oscillation, North Atlantic Oscillation, outgoing longwave radiation, Pacific–North American pattern, Pacific Decadal Oscillation, Southern Oscillation Index, and sea surface temperature anomalies in seven regions. First, they assessed correlations between coupons and index lags from 2 to 18 months. Then they compared linear regression with seven algorithms: random forest, Bayesian ridge regression, gradient boosting, extremely randomized trees, automatic relevance determination regression, LightGBM, and XGBoost. For feature selection they used Elastic Net, and hyperparameters were tuned via random search with 5-fold cross-validation.
Results
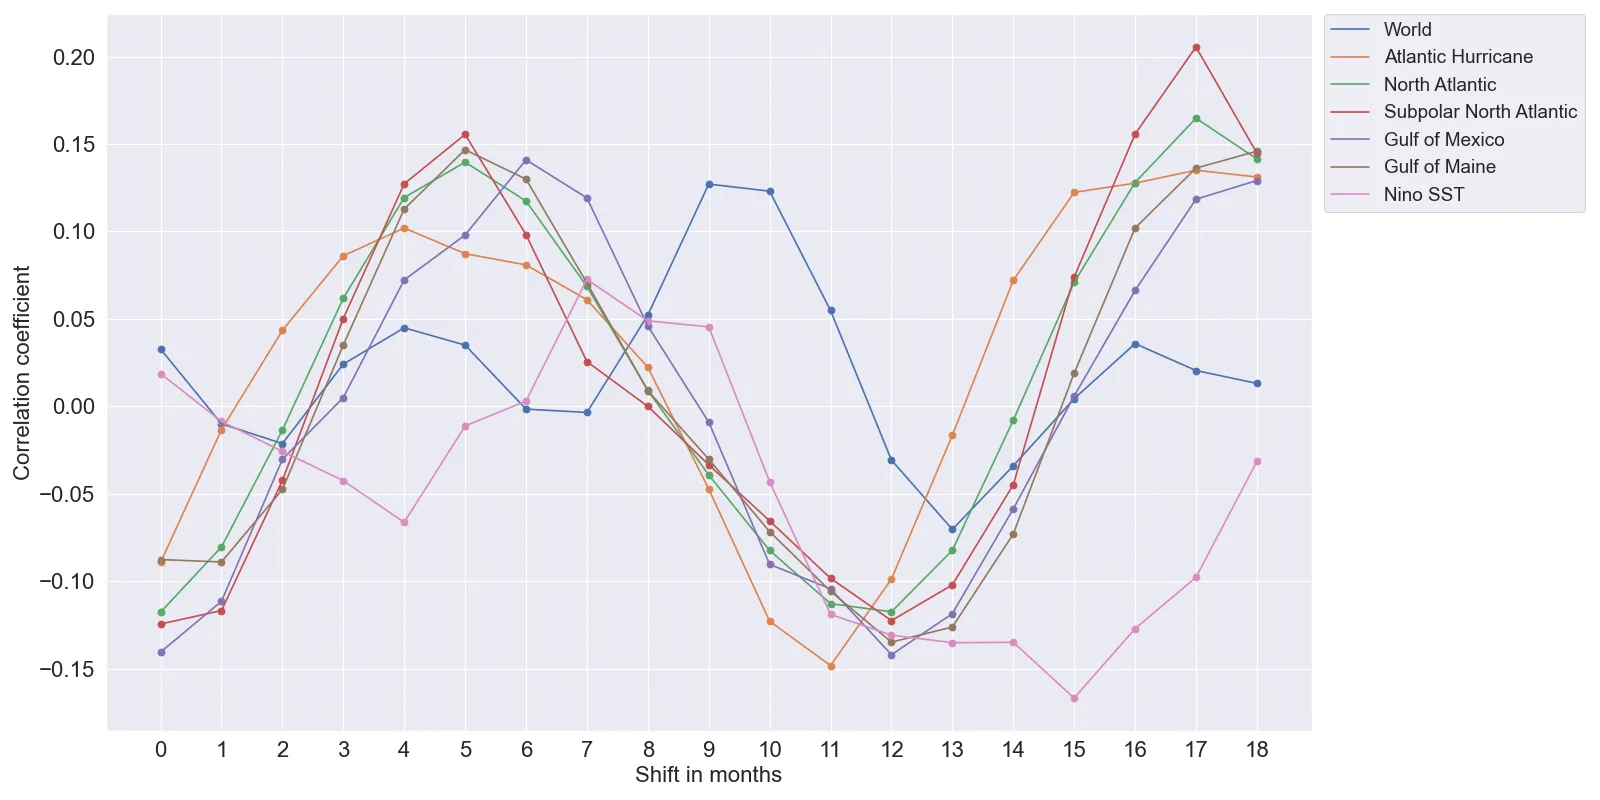
Correlation analysis showed that outgoing longwave radiation, the Southern Oscillation Index, and the Pacific–North American pattern have the strongest positive correlations with coupons, especially at lags of 10–16 months. In contrast, the Pacific Decadal Oscillation and the El Niño index correlate negatively or weakly. Regional sea surface temperature anomalies in the Atlantic hurricane region, the Gulf of Mexico, and the North Atlantic are more strongly linked to coupons than global or El Niño indicators. Including climate variables improved all models: for linear regression, RMSE dropped from 0.01774 to 0.01682, and for extremely randomized trees from 0.01416 to 0.01229, a 13.2% reduction. Probabilistic forecasts also became more accurate: the proportion of misses at the 5% VaR level fell from 4.35% to 1.45%, and both models entered the green zone of the Basel traffic light.
Implications
This work differs from its archive neighbors by linking climate indices to a financial instrument through ensemble methods, whereas neighboring studies address weather forecasting, neural network training, or climate signals in isolation. It is the first test showing that large-scale climate variability measurably affects catastrophe bond coupons, with the effect appearing after a delay of several months. For reinsurance market practitioners, this means that accounting for climate lags can reduce pricing error and improve risk assessment.
Future development
The topic could evolve toward a more nuanced treatment of nonlinear interactions between climate indices and regional risk characteristics. Additional data could be incorporated, such as satellite observations of cloud cover or local meteorological records. Applying deep learning models that can automatically extract features from climate indicator time series is also promising.
Impact
The results could influence catastrophe bond underwriting practices, climate risk assessment models in reinsurance, and stress-testing tools for financial portfolios.
Next steps
The next step could be testing the models on the secondary market for catastrophe bonds and on data after 2020 to confirm the robustness of the found relationships. It would also be worth studying how climate indices interact with reinsurance market cycles.
Key open problems
In catastrophe bond pricing, an unresolved question remains: how to separate the contribution of climate variability from cyclical market factors, and how to properly account for rare but extreme events. This work shows that climate indicators add information, but it does not solve the problem of tail risks and non-stationarity of climate series.
The knowledge machine's view
This section is addressed to the author of the paper and their colleagues. Neighbouring works were found by meaning-based search across our archive, not by word overlap. We do not review: we show the field around the work.
What the work does
The authors collected 734 tranches of catastrophe bonds issued between 1997 and 2020, added eight climate indicators, and compared seven machine learning models. Including climate variables improved coupon forecasts: for extremely randomized trees, RMSE dropped from 0.01416 to 0.01229, and the miss rate at the 5% VaR level fell from 4.35% to 1.45%.
Where its strength is
This work is the first to link large-scale climate variability to catastrophe bond pricing through ensemble methods, showing that climate indices systematically improve forecast accuracy.
Where it could go next
- In our archive, there is a study on how a neural network, reading weather backward, warns of droughts months in advance. It might be interesting to see if a similar approach could be adapted to predict disaster probabilities over a horizon matching bond maturity.based on: How a neural network, reading weather backwards, warns of drought months in advance arXiv:2607.00331
- There is work on predicting El Niño a year and a half ahead. If such long-term forecasts of climate indices become reliable, they could be used as input features for pricing future bond issues, which might be useful for the primary market.based on: El Niño Can Be Predicted a Year and a Half in Advance arXiv:2601.12251
- The archive also features an analysis of the 'Mirage of the Full Reservoir,' discussing the illusion of abundance and its cost. It might be interesting to explore how similar systematic biases in risk perception could affect catastrophe bond pricing if investors underestimate climate signals.based on: The Full Reservoir Mirage: The Illusion of Abundance and Its Cost arXiv:2607.00504
Worth trying
- Test whether adding forecasted values of climate indices, rather than current or lagged ones, improves predictions.
- Assess how the contribution of climate features changes when bonds are split by disaster type (hurricanes, earthquakes) or region.
- Use model interpretation techniques (e.g., SHAP) to identify the most influential climate variables and their threshold values.
Why this may matter
If climate variability indeed affects catastrophe bond coupons, this could help investors better assess risks and insurers structure issuances more precisely, especially in a changing climate.
Nearby works in our archive
- How a neural network, reading weather backwards, warns of drought months in advancesimilarity 0.50
- The Ocean Conveyor on the Brinksimilarity 0.49
- Cloud Spices: How a Neural Network Improves Climatesimilarity 0.49
- Solar Flares: Forecasting with Confidencesimilarity 0.47
- Why Some Vortices Are Predictable and Others Aren'tsimilarity 0.47
- When Climate Sends an Early Signalsimilarity 0.47
- El Niño Can Be Predicted a Year and a Half in Advancesimilarity 0.46
- The Full Reservoir Mirage: The Illusion of Abundance and Its Costsimilarity 0.45
The archive is sparse around this work: the closest review is only 0.50, against a usual 0.64. It looks like few have drilled nearby.
Climate indices were shifted back by up to 18 months to capture the delayed influence of the ocean and atmosphere on bond prices. The strongest link was found for outgoing longwave radiation at a lag of 12 months, meaning tropical convection affects coupons a year later.
Key numbers
- RMSE of extremely randomized trees: 0.0123
- RMSE reduction when adding climate: 13.2%
- VaR miss rate of the extended model: 1.45%
- Number of tranches in the sample: 734
- Maximum lag of climate indices: 18 months