El Niño Flavors: An Ocean Palette Instead of Two Colors ✛
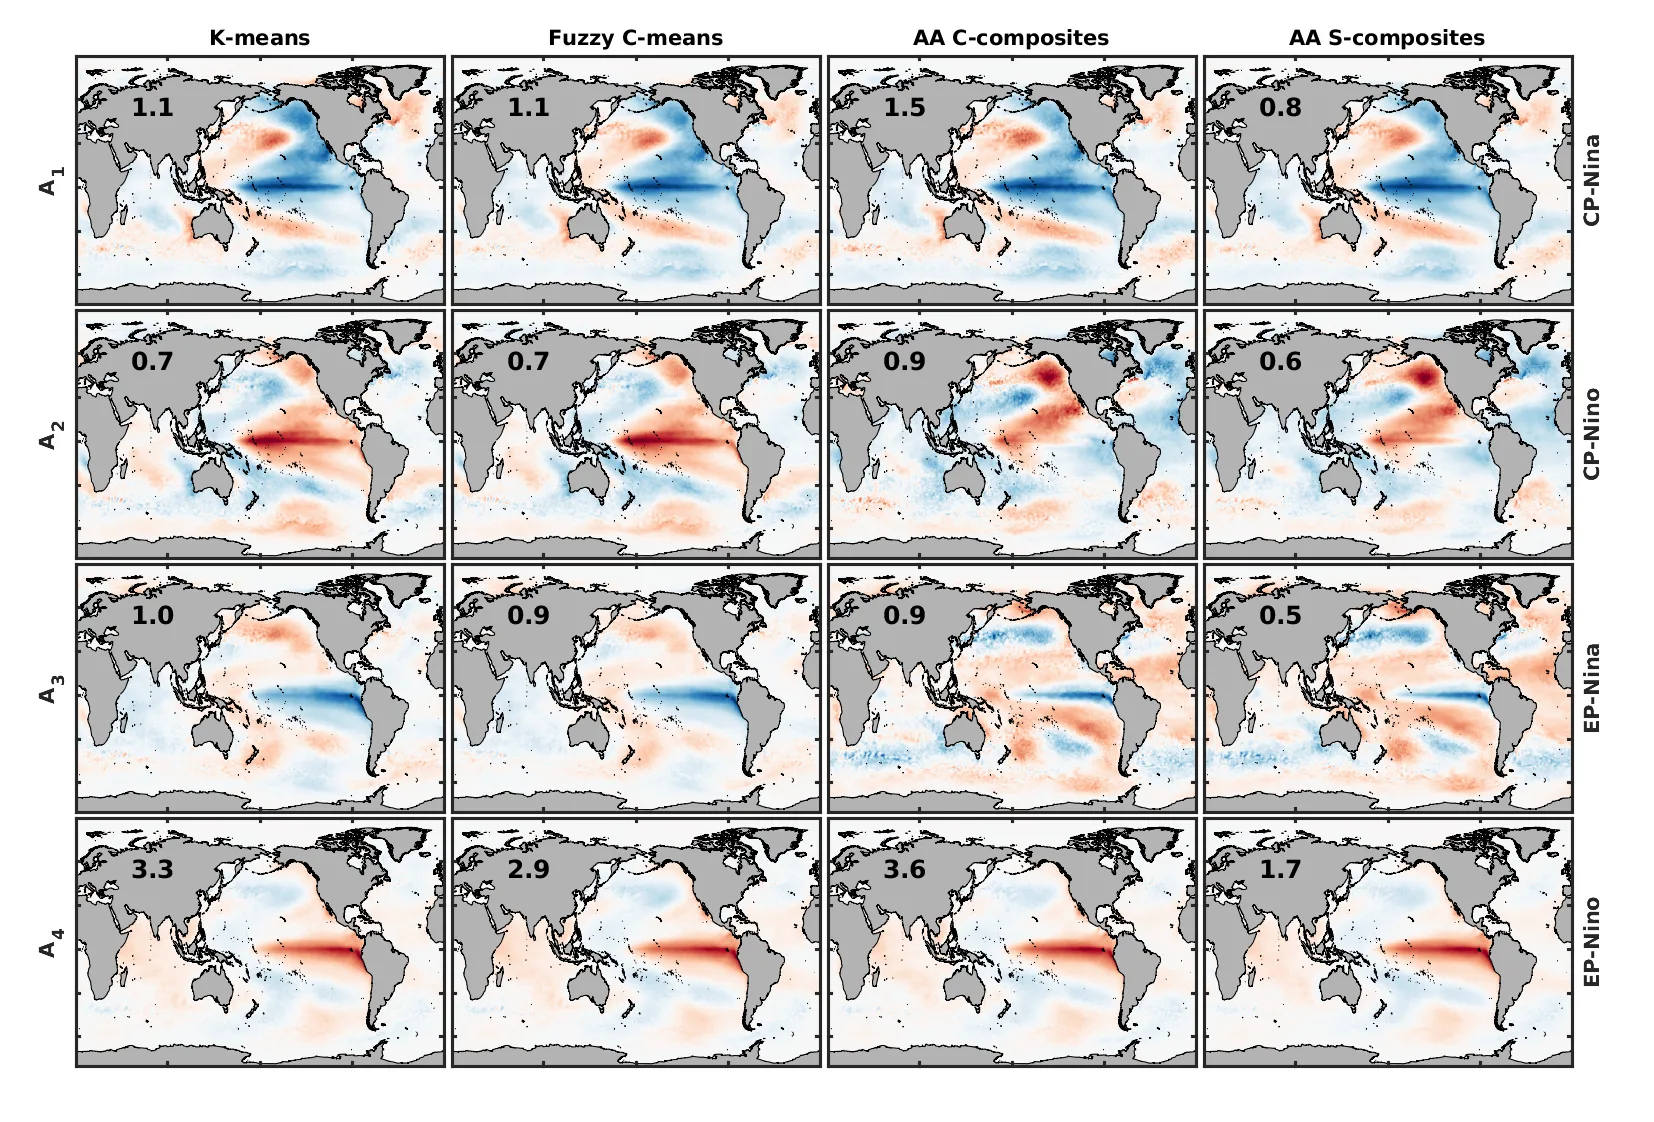
An artist painting the ocean does not limit themselves to two colors: warm and cold. Likewise, climatologists studying El Niño increasingly speak of a whole palette of shades. El Niño is a warm current off the coast of Peru that, every few years, alters weather across the planet. Its counterpart, La Niña, brings cold. But between these extremes lie intermediate states, each affecting rains and droughts in its own way.
The authors applied a method that seeks not average states but the most extreme ones, much as an artist first finds pure, unmixed colors on a palette. These extreme states are called archetypes. Taking monthly sea surface temperature maps over 41 years, the researchers subtracted global warming to avoid interference and asked the algorithm to find four most characteristic configurations. The result was familiar types: central Pacific and eastern Pacific variants of El Niño and La Niña.
When the number of archetypes was increased to eight, the palette became richer. Shades corresponding to the onset and decay of the phenomenon emerged. For instance, three major eastern Pacific El Niños (1982–1983, 1997–1998, 2015–2016) had different sequences of phases before and after the event. One of them, the 1982–1983 event, was so unusual that traditional monitoring systems initially missed it: warm anomalies appeared where they were not expected.
The method does not impose rigid boundaries between types. For each time step, it computes the probability of belonging to each archetype. This allows tracking how pure or mixed the current state is. Operational centers can use this approach for monitoring and complementing seasonal forecasts with information about the El Niño type. The artist, at last, has not just two colors but a full palette to paint the climate picture more accurately.
One of the largest eastern Pacific El Niño events, in 1982–1983, was so unusual that traditional monitoring systems initially missed it, because the warm anomalies appeared where they were not expected.