El Niño Flavors: Archetypal Analysis of Global Ocean Temperature ✛
Context
Operational centers have long noticed that simple indices based on sea surface temperature do not always capture the full diversity of El Niño. Over recent decades, several types have been identified: the canonical eastern Pacific, central Pacific, Modoki, and others. Debates about how many "flavors" of El Niño exist are ongoing, and each classification method gives a different answer. This work sits alongside studies that attempt to predict El Niño up to a year and a half ahead or peer into the "mind" of weather AI, but it differs by not imposing predefined regional boundaries and instead seeking extreme states in the global temperature field.
Methods
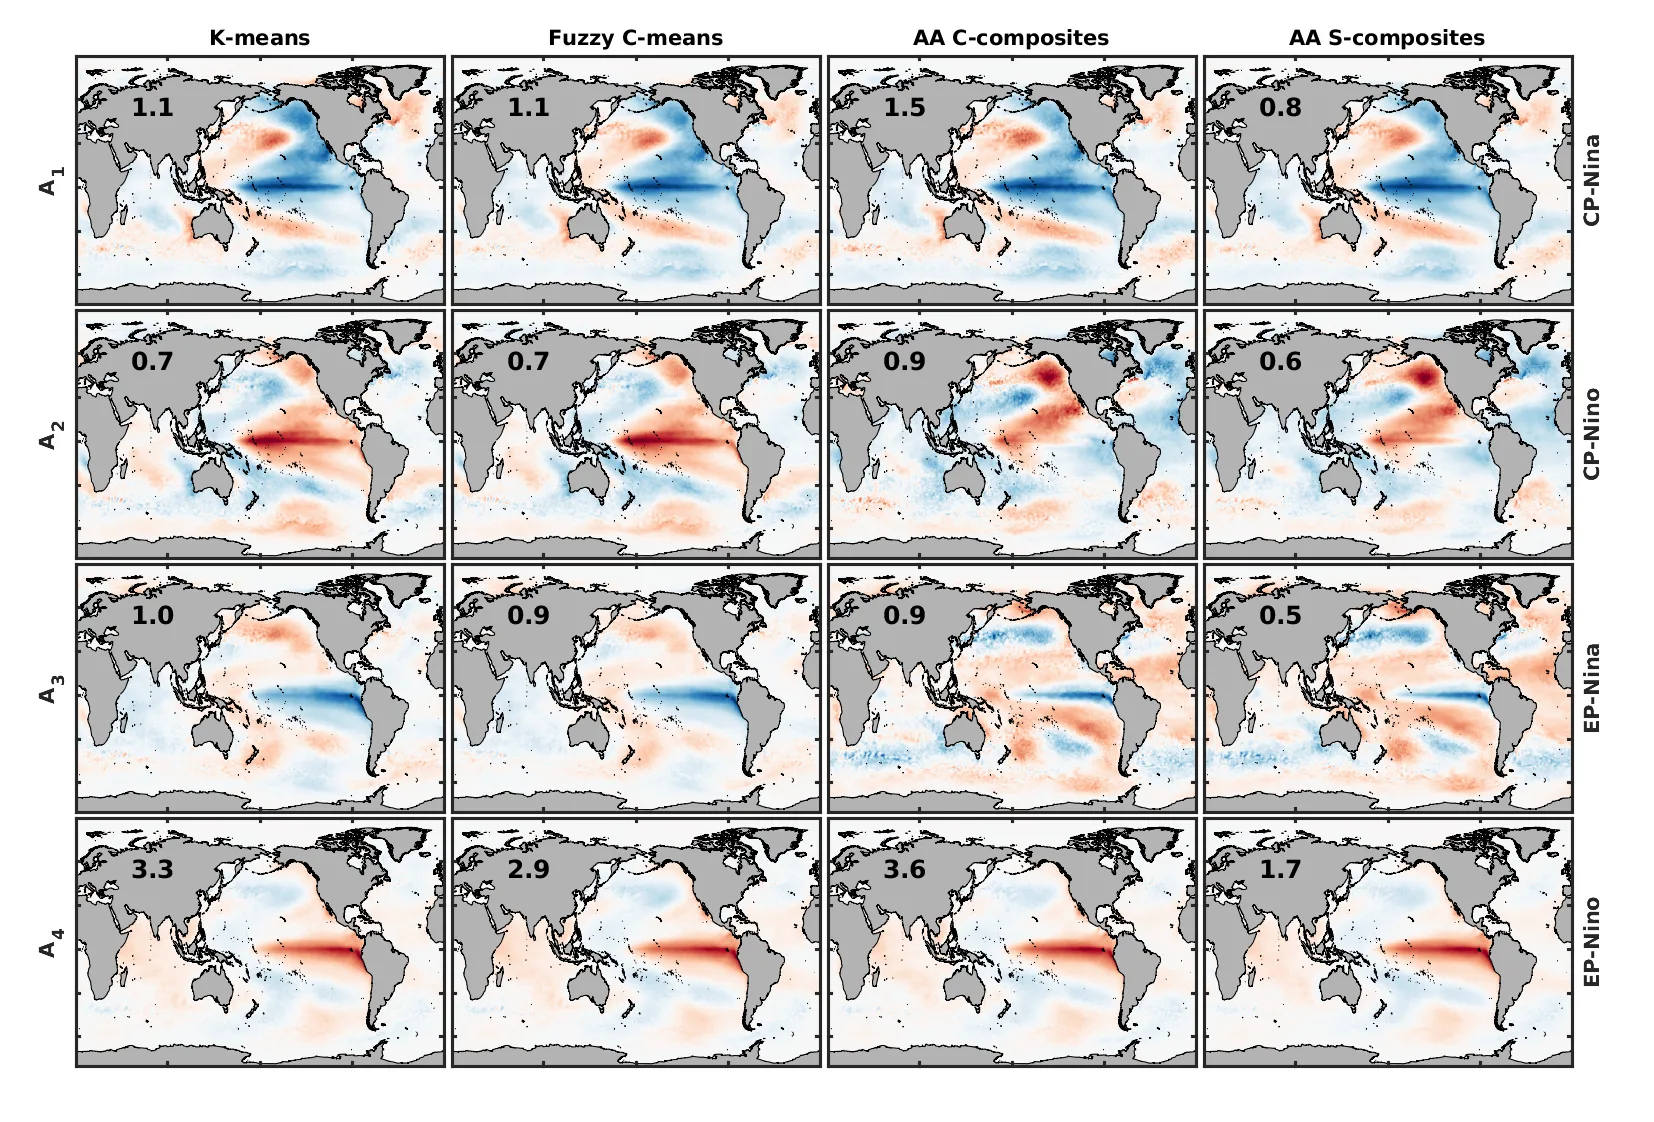
The authors used monthly sea surface temperature anomalies (OISST v2.1) from 1982 to 2022, subtracting a linear trend at each grid point to remove the contribution of global warming. They then applied archetypal analysis, a method that finds extreme points on the convex hull of the data. Unlike K-means clustering, archetypes lie not at the center of the data cloud but on its boundary, corresponding to the most extreme states. To speed up computation, the data were first compressed using principal component analysis, retaining 100% of the variance. The number of archetypes (cardinality) was varied from 2 to 20, but the main conclusions are drawn for 4 and 8. Results were compared with K-means and fuzzy C-means clustering.
Results
With four archetypes, the method identified four familiar states: central Pacific La Niña and El Niño, and eastern Pacific La Niña and El Niño. Increasing cardinality to eight added new nuances, especially during transition periods. For example, the three major eastern Pacific El Niño events (1982–1983, 1997–1998, 2015–2016) each showed distinct phase sequences before and after the event. Analysis of sea level anomalies gave a clearer phase separation: when surface temperature did not allow confident classification, sea level showed a pronounced archetype. The probabilistic nature of the method allows computing a "discrimination score" that indicates how close the current state is to a pure archetype or a mixture.
Implications
This work shows that El Niño diversity can be described not by rigid categories but by probabilistic membership in several extreme types. This differs from neighboring studies that often use fixed indices or clustering methods yielding symmetric and less flexible patterns. Archetypal analysis does not require preselecting geographic boundaries and can therefore capture global connections, including extratropical responses. Using sea level instead of surface temperature opens a path to more robust monitoring under a changing climate.
Future development
The method can be extended to other climate modes: the North Atlantic Oscillation, the Pacific–North American pattern, the Southern Annular Mode, and the Indian Ocean Dipole. For forecasting on timescales from weeks to seasons, an online updating procedure is proposed: archetypes are trained on historical data, and then for each new forecast field, membership probabilities are computed. This would allow operational centers to supplement existing warning systems with information about the El Niño type and its potential impacts.
Impact
Climatology and oceanography: improved classification of El Niño phases and their teleconnections. Operational forecasting centers: more detailed information about the event type for bulletins and warnings.
Next steps
Test the method on seasonal forecasts and assess how well models reproduce archetypes. Explore applicability to other fields, such as salinity or subsurface temperature.
Key open problems
Connection to unresolved problems in climatology: there is still no consensus on whether different El Niño types are dynamically distinct phenomena or manifestations of a single continuum. Archetypal analysis offers a way to describe this continuum without imposing rigid boundaries, but the question of statistical distinguishability of patterns remains open due to the short observational record.
The knowledge machine's view
This section is addressed to the author of the paper and their colleagues. Neighbouring works were found by meaning-based search across our archive, not by word overlap. We do not review: we show the field around the work.
What the work does
The authors apply archetypal analysis to global sea surface temperature anomalies from 1982 to 2022, identifying extreme states corresponding to different types of El Niño and La Niña. They show that increasing the number of archetypes reveals additional nuances of the phenomenon, and using sea level anomalies provides a clearer separation of phases. The method allows computing the probabilistic membership of the current state to archetypes, which is suitable for operational monitoring.
Where its strength is
The strength of the work is that archetypal analysis does not impose predefined geographical boundaries and can therefore capture global connections, including extratropical responses, and it provides a probabilistic rather than a rigid classification of states.
Where it could go next
- It might be interesting to see how probabilistic membership in archetypes relates to El Niño predictability at long lead times: there is a paper in the archive about predicting the event one and a half years ahead, and one could check whether knowing the current archetype improves the quality of such forecasts.based on: El Niño Can Be Predicted a Year and a Half in Advance arXiv:2601.12251
- Perhaps it is worth investigating how archetypes derived from surface temperature relate to deep ocean processes: the archive contains an analysis of Earth's subsurface heat, discussing methods for probing heat content, and comparing with the vertical structure of the ocean could yield new shades of the phenomenon.based on: An Underwater Hunter for Earth's Heat arXiv:2606.20780
Worth trying
- Test how archetypes based on sea level match those based on surface temperature during transition periods.
- Use archetypal analysis to estimate the probability of different types of El Niño occurring in the following seasons based on the current state.
- Compare the discrimination score with known indices (e.g., ONI, EMI) in retrospective forecasts.
Why this may matter
If probabilistic classification by archetypes turns out to be linked to the predictability and impacts of El Niño, it could improve operational monitoring and forecasting, and also help in assessing regional climate risks.
Nearby works in our archive
- An Underwater Hunter for Earth's Heatsimilarity 0.50
- A Frozen Snapshot of Planet Birthsimilarity 0.46
- Thermal Split: How Uneven Heating Divides a Mixturesimilarity 0.46
- Ice Has a Memory: How Antarctica Responds to Carbon Dioxidesimilarity 0.46
- How Stratospheric Weather Alters Particle Counters Deep Undergroundsimilarity 0.46
- El Niño Can Be Predicted a Year and a Half in Advancesimilarity 0.45
The archive is sparse around this work: the closest review is only 0.50, against a usual 0.64. It looks like few have drilled nearby.
One of the largest eastern Pacific El Niño events, in 1982–1983, was so unusual that traditional monitoring systems initially missed it, because the warm anomalies appeared where they were not expected.
Key numbers
- number of archetypes for main analysis: 4 and 8
- data period: 1982–2022 (41 years)
- variance explained by first EOF: 14.1%
- maximum temperature anomaly for EP-Niño archetype: +4.2°C
- average duration of EP-Niño at cardinality 8: 7–8 months