Heartbeat vs. Noise: How to Spot Chaos at a Black Hole ✛
In 2019, the Event Horizon Telescope gave humanity the first image of a black hole's shadow. Since then, astrophysicists have dreamed of more: seeing how matter moves in the very funnel of spacetime. One of the mysteries is chaos. Theory predicts that particle orbits around a black hole can be regular, like a heartbeat, or chaotic, like noise. But how can we notice this from Earth?
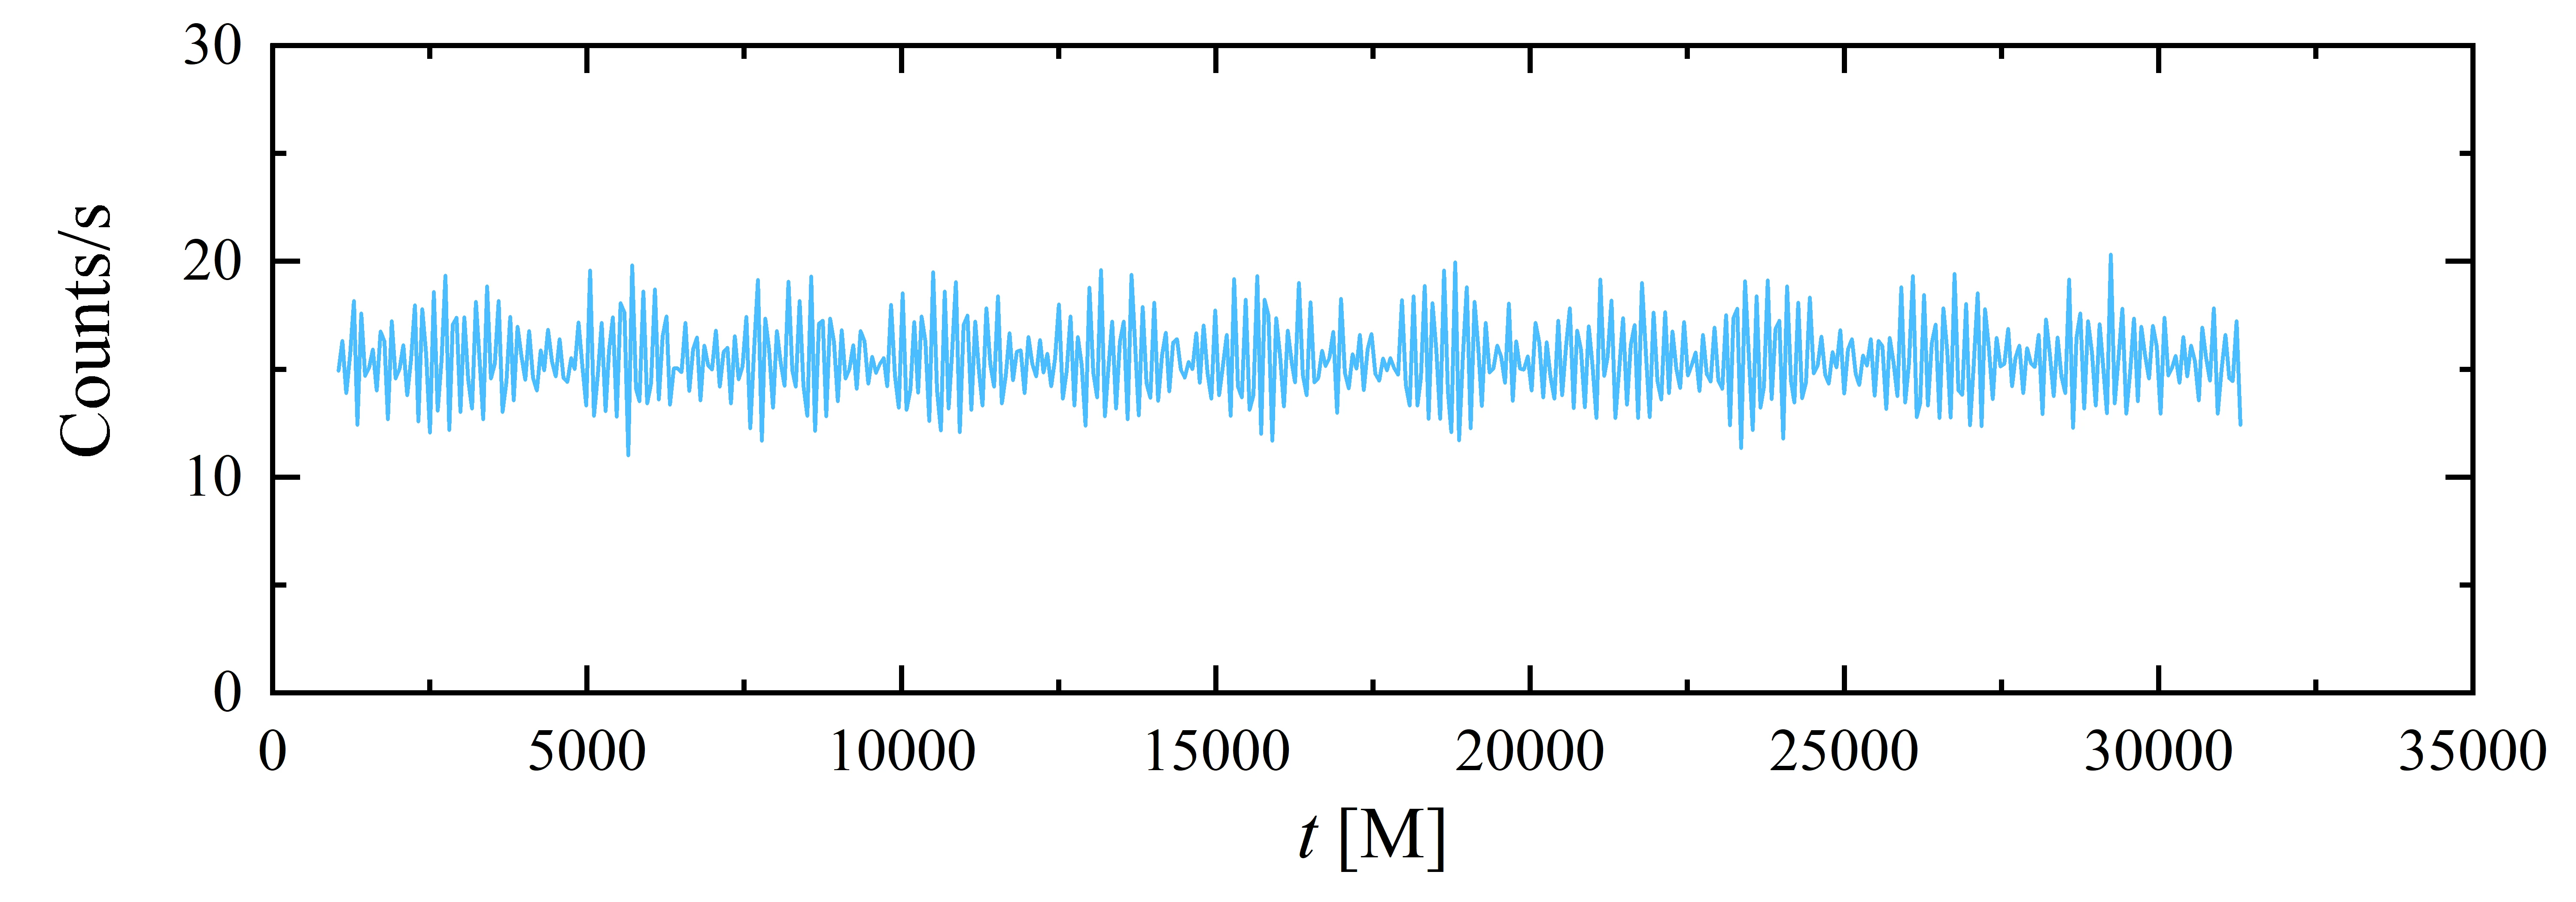
The research team built a numerical model of a hot spot, a bright blob of plasma moving in the field of a rotating black hole (Kerr metric) under the influence of an external electromagnetic field. For six orbits, three regular and three chaotic, they calculated light curves, that is, graphs of brightness variation over time. The observer looked at an angle of 17 degrees, and the image had a resolution of 6000×6000 pixels.
The result was elegant. For regular orbits, the light curves resemble a steady heartbeat: clear periodicity, and the power spectrum, which is the distribution of signal energy across frequencies, consists of narrow isolated peaks. Chaotic orbits produce erratic fluctuations, and their power spectrum looks like noise: broad continuous bands of low amplitude. Even when a regular orbit shows no obvious periodicity in the light curve, its spectrum still reveals sharp peaks. This is the sought-after signature.
Until now, there was no reliable way to observationally distinguish chaotic orbits from regular ones near black holes. Now there is: just take the light curve of a hot spot and look at its power spectrum. The method can already be applied to analyze flares from the supermassive black hole at the center of our Galaxy, Sgr A*. If broad bands are found in the data instead of narrow peaks, this would be the first observational evidence of chaos in curved spacetime.
In the future, the method can be extended to more realistic accretion models, to hot spots with spin, and to modified theories of gravity. With more sensitive X-ray and infrared telescopes, astronomers will be able to search for chaotic signatures in real data. Thus, the flickering of a single hot spot could become a key to testing the very nature of gravity.
The Lyapunov exponent for chaotic orbits starts to diverge after about 1000 black hole masses of time: for a supermassive black hole this is millions of years, but for a stellar-mass one, only fractions of a second.
In the movie 'Interstellar', the accretion disk and hot spots around the black hole Gargantua are visualized; this work shows how the flickering of such spots could reveal chaos in their motion.