Least squares is a statistical optimization method used to fit a mathematical model to observed data by minimizing the sum of the squares of the differences (residuals) between observed and predicted values. It is the foundational technique for regression analysis, enabling estimation of parameters in linear and nonlinear models. In physics, it is ubiquitous for extracting constants from experimental data, such as determining the gravitational constant or calibrating sensors.
History
Developed independently by Carl Friedrich Gauss (1795, published 1809) and Adrien-Marie Legendre (1805). Gauss used it to predict the orbit of the dwarf planet Ceres, demonstrating its power in astronomical data analysis.
How it works
Given a set of data points (x_i, y_i) and a model function y = f(x, parameters), the method adjusts the parameters to minimize Σ (y_i - f(x_i))². For linear models, this reduces to solving a system of normal equations, yielding closed-form solutions. For nonlinear models, iterative algorithms like Gauss-Newton or gradient descent are used. The squared penalty ensures that large errors are disproportionately penalized, leading to a best-fit line or curve that balances overall deviation.
In practice
Used in virtually every field of science and engineering — from fitting calibration curves in spectroscopy to estimating parameters in econometric models and machine learning algorithms.
Fun fact
The method's name comes from the fact that it minimizes the sum of squared residuals, but it also corresponds to the maximum likelihood estimate when errors are normally distributed — a connection established by Gauss.
4 610 universes — that's exactly how many cosmological models astrophysicists needed to show that the familiar Gaussian mask no longer works for next-generation data. Future sky surveys, such as the Euclid mission and the Vera C.
In a three-dimensional scene, each point is like a candy whose color changes depending on the viewing angle. To describe this play of shades, dozens of numbers are stored for each point — a special mathematical function invented by Joseph Fourier. Memory fills up instantly.
The standard approach to a certain class of machine learning problems is like a spring that's been stretched and then forgotten: standard methods artificially inflate the problem's size, turning computations into a black hole for memory and time.
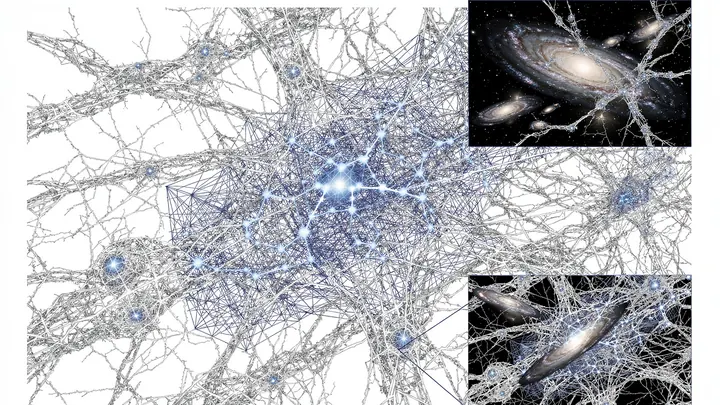
Light from distant galaxies travels to us for billions of years, but along the way it gets bent and twisted by the invisible web of dark matter. This effect, predicted by Albert Einstein within general relativity, is called gravitational lensing.
Quantum spin chains resemble a line of people passing along a secret handshake: each turns to a neighbor, and how firmly they clasp palms determines how the wave runs through the entire chain. In the ideal Heisenberg chain, quantum magnetism’s bedrock, all handshakes are equal.
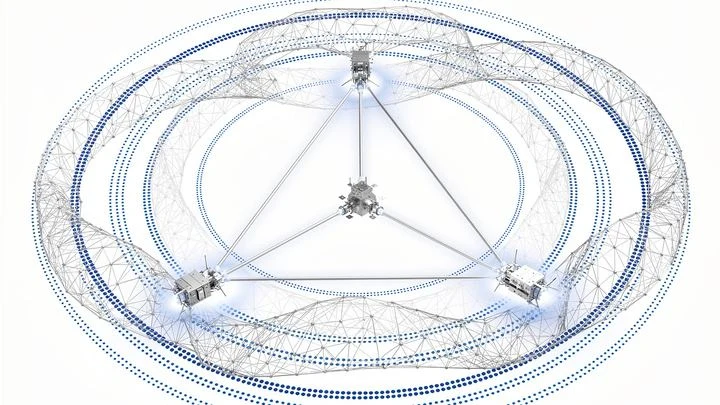
The Universe is not silent: it is filled with a continuous gravitational-wave hum. In a decade, the LISA space observatory will tune its "ears" to the millihertz range, and the richest source will be our Galaxy — tens of thousands of white dwarf pairs whirling in a frantic dance.
A mosaic of large colored tiles. Each tile is the average precipitation over an entire month for an area the size of a small country. For a general understanding, the picture is fine, but if you need to know whether a downpour hit a specific city yesterday, it's useless.
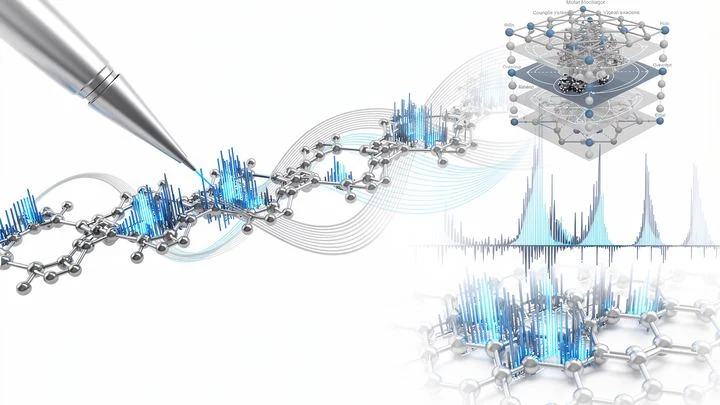
Imagine a factory where hundreds of tiny assembly lines run nonstop. Each line is a molecular motor that converts chemical fuel into motion. To make the motor go faster or in the right direction, an engineer tweaks the settings — the shape of parts, the strength of interactions.
Quantum annealing works like a smart way to find a path through a maze: instead of checking every dead end, it uses quantum effects to find the exit faster. But this maze has a quirk: the numbers that describe the walls and corridors must be roughly the same size.
A laser flash lasts a few femtoseconds — imagine a single instant stretched into a million parts. Such a flash mixes many colors, from red to violet. Instruments that measure the pulse shape often err: they see some colors well and others poorly, blurring the picture.
The authors propose a simple fix.
A dense social network: everyone is connected to almost everyone else, and in this web it's hard to see who really matters. Too many threads — computers choke, simulations stall. Scientists have figured out how to prune such networks without losing what's essential.
The idea is to remove connections that don't participate in shortest paths.
Glowing spots on a dark background: that's what single-molecule images from MINFLUX look like. This microscope can reveal details smaller than five nanometers: roughly ten thousand times thinner than a human hair.
A quantum processor is like an orchestra where each musician (qubit) must play their part precisely in time. But in reality, the instruments go out of tune: qubits lose energy, and their interactions get distorted. To tune this orchestra, you first need to record how it sounds right now: that is, measure the noise parameters and couplings.
Our body's tissue is like a city: different neighborhoods are home to different cells, each with its own job. To understand how this city is organized, biologists take images showing which genes are active at each spot. But sharp images are expensive, and cheap ones come out blurry, like a photo of a city from high above, where individual buildings are hard to make out.
Imagine a photographer shooting a tall building, but instead of a single frame, they take a series of shots while moving the camera in a spiral from top to bottom. This approach captures more detail in less time, but the images can come out blurry. A similar challenge faces MRI machines when they need to quickly image the brain.
A chemical map of a sample is like a mosaic: each point has its own color, its own chemical composition. To assemble such a mosaic, a spectromicroscope scans the sample point by point, recording a spectrum at each location — a "fingerprint" of how the material absorbs or emits light.
When a top quark is born in a particle detector, it immediately decays into a shower of other particles. Catching a hint of new physics in that shower is like hearing a whisper at a rock concert. You need not just a good microphone, but the ability to subtract the roar of the amplifiers and the hum of the crowd.
Climate scientists have long debated where exactly the El Niño "pool" is located: the region in the equatorial Pacific that first responds to an impending weather shift. The debate isn't due to a lack of data. The ocean is measured along longitude, latitude, and depth, and each slice contains thousands of numbers. The problem is that there are too many numbers to see the pattern directly.
Every winter, the Pacific Ocean warms slightly off the coast of Peru, and every summer it cools. This rhythm is set by the gears of the climate machine, but some turn fast, others slow, and still others speed up or stall. Linear inverse models have helped us glimpse these gears in data for decades, but they were blind to seasonal changes in pace.
An optician turns the frame, adjusts the focus, and a blurry spot becomes a sharp image. The new algorithm GOAL works much the same way: it rotates the data cloud, compresses redundant dimensions, and brings into focus what truly matters.
Imagine a border river that separates two countries. On one bank live one group of people, on the other, another. The boundary between them is not always obvious: in some places the river is wide and calm, in others narrow and turbulent. But it is exactly where the current changes abruptly that the border becomes most noticeable.
A translator learns not from a dictionary but from speech. They listen to native speakers and pick up rules that are written in no textbook. Similarly, a new method for forecasting complex systems such as climate or turbulence does not require knowing their equations. Instead, it looks at data and learns to predict their behavior.