Turbulence in Space: How Clouds Change the Chemistry of Stars express
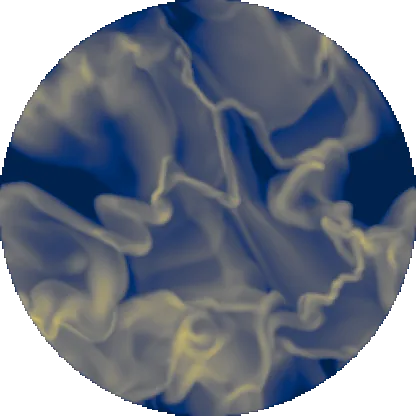
A boiling cauldron: steam rises, water churns, and the temperature varies from point to point. So it is in space: the gas clouds around young stars are not smooth spheres but a seething mixture with vortices and density fluctuations. Astronomers long treated such clouds as homogeneous, but this simplification can skew conclusions.
Scientists built a computer model of a cloud around a single hot star — with and without turbulence. They found that vortices directly affect the brightness of emission lines: the nitrogen line [N II] becomes brighter, while the oxygen line [O III] becomes fainter. This throws off estimates of metallicity (how many heavy elements are in the gas) and other properties. The error reaches 0.1 dex, as if you were weighing sugar on a scale that always lies by 20%.
The difference is also visible in density: infrared, optical, and ultraviolet indicators give different numbers for the same cloud. It's like measuring a person's height with different rulers: each shows something different. For precise conclusions, we need large tables of models with turbulence that cover conditions in both nearby and distant galaxies.
Original abstract
as written by the authors arXiv:2602.02949
Reliable nebular emission line diagnostics are essential for accurately inferring the physical properties (e.g. electron temperature, density, pressure, and metallicity) of H II regions from spectra. When interpreting spectra, it is typical to adopt a single zone model, e.g. at fixed density, pressure, or temperature, to infer H II region properties. However, such an assumption may not fully capture the complexities of a turbulent interstellar medium. To understand how a complex density field driven by supersonic turbulence impacts nebular emission lines, we simulate 3D H II regions surrounding a single O star, both with and without supersonic turbulence. We find that turbulence directly impacts the values of common strong line ratios. For example turbulent H II regions exhibit systematically higher [N II]/H$$\alpha$$, lower [O III]/H$$\beta$$, and lower O32, compared to homogeneous H II regions with the same mean density and ionizing source. These biases can impact inferences of metallicity, ionization parameter, excitation, and ionization source. For our choice of turbulence, direct $$T_e$$ method metallicity inferences are biased low, by up to 0.1 dex, which is important for metallicity studies, but not enough to explain the abundance discrepancy problem. Finally, we show that large differences between measured electron densities emerge between infrared, optical, and UV density indicators. Our results motivate the need for large grids of turbulent H II regions models that span the range of conditions seen at both high and low redshift to better interpret observed spectra.
Turbulence in interstellar gas can be triggered by supernova explosions — shock waves stir the gas like a spoon stirring sugar into tea.