Climate Waves: How Solar Cycles Echo in Brazil's Rainfall ✛
Context
The climate of northeastern Brazil is known for sharp swings: years of abundant rain alternate with severe droughts. These swings occur on various timescales, from within-year to multi-decadal. Understanding such cycles is important for water resource planning and agriculture. However, it remained unclear how much of the low-frequency rainfall variability is linked to global processes: solar activity and large-scale ocean-atmosphere circulation. This work fills that gap by comparing long observational records with wavelet analysis, which reveals how the periodicity of a signal changes over time.
Methods
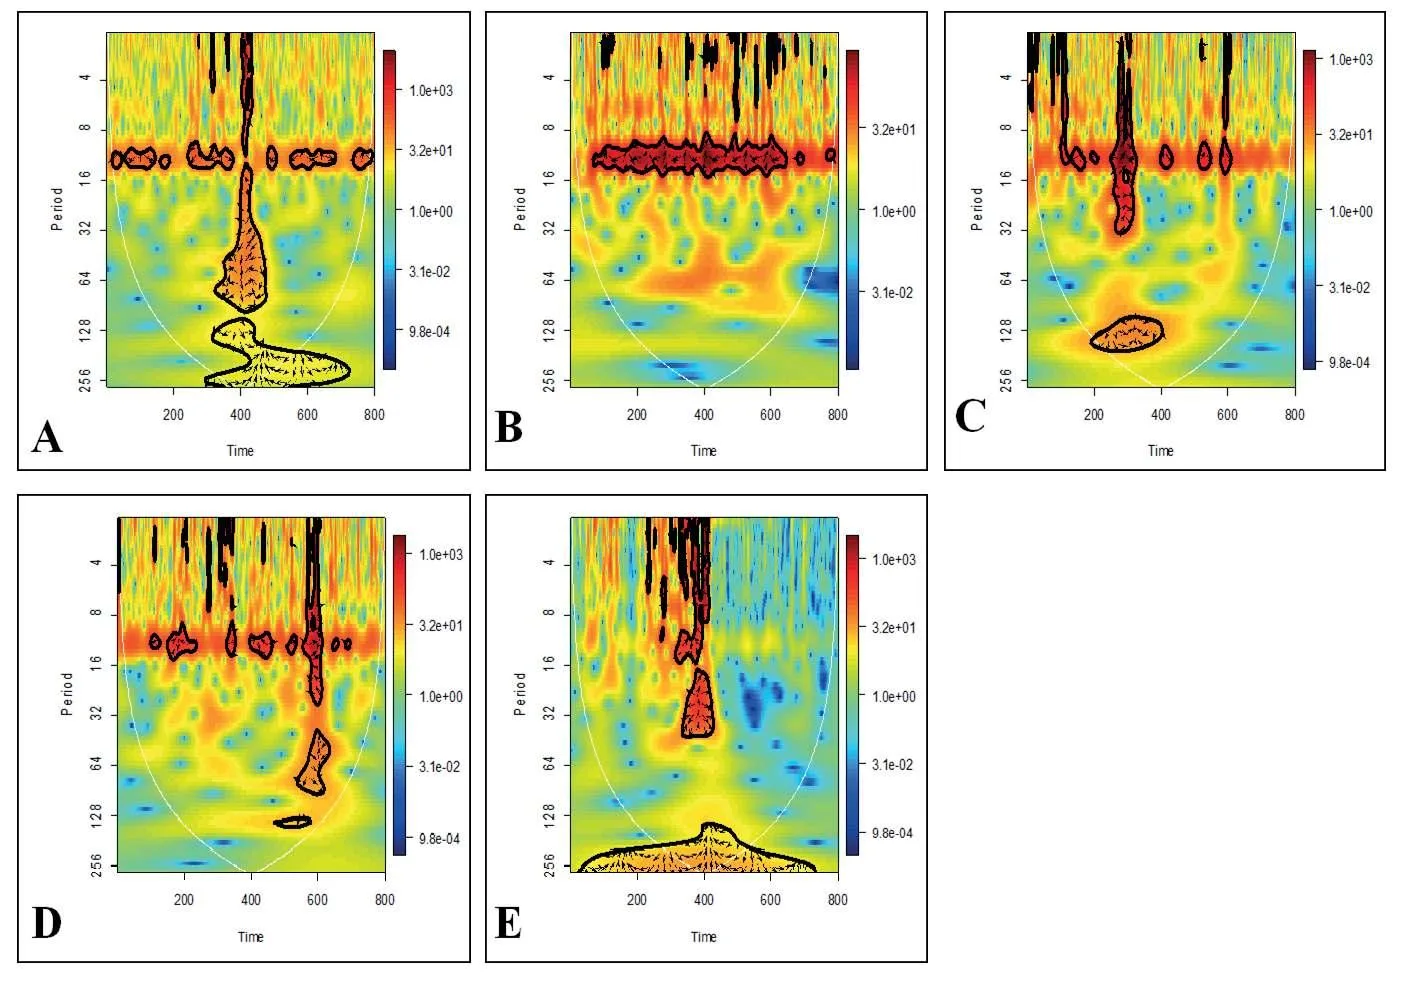
The authors used monthly data from January 1933 to September 2016 (993 months) for three series: the Southern Oscillation Index (SOI), the Pacific Decadal Oscillation (PDO) index, and the monthly mean sunspot number. For rainfall, they used series from January 1951 to September 2017 at five weather stations at the airports of Belem, Sao Luis, Fortaleza, Natal, and Fernando de Noronha. The analysis was performed in the R statistical environment with the WaveletComp and biwavelet packages. They applied the Morlet wavelet transform with angular frequency 6, as well as cross-wavelet and wavelet coherence for pairs of series. Wavelet power spectra were constructed after bias correction following Liu et al. (2007) and Veleda et al. (2012).
Results
In all three global series (SOI, PDO, sunspots), pronounced cycles were found with periods around 32 months (2.66 years), 64 months (5.33 years), 128 months (10.66 years), and 256 months (21.33 years). The most stable was the 11-year sunspot cycle, which also appears in the ocean indices. Cross-wavelet analysis showed synchrony of these cycles between series: for example, the PDO-SOI pair is dominated by the 21.33-year signal, while the sunspot-SOI pair shows the 10.66-year signal. In the rainfall series from the five stations, periods of 5.33, 10.66, and 21.33 years also stand out, with the 11-year cycle well expressed in Belem, Fortaleza, and Natal, and the 21-year cycle in Belem and Fernando de Noronha. All stations show a strong annual (12-month) peak, as expected for tropical rainfall.
Implications
The results confirm that low-frequency rainfall variability in northern and northeastern Brazil is not random but synchronized with global climate indices and solar activity. The presence of common cycles of 10.66 and 21.33 years points to a possible mechanism linking solar influence to oceanic circulation and regional rainfall. This contributes to understanding natural climate variability, which must be separated from the anthropogenic trend. For hydrology and agriculture in the region, such cycles could serve as a basis for statistical forecasts decades ahead.
Future development
In the future, the authors plan to study how the position of the Intertropical Convergence Zone (ITCZ) and the phases of the Atlantic Meridional Mode (AMM) modulate rainfall in the region on these timescales. They also intend to analyze the superposition of multi-decadal, intra-decadal, and seasonal cycles to identify periods of constructive interference when droughts or floods are amplified. The analysis may be extended to other meteorological variables and longer records.
Impact
The work touches on climatology, hydrology, agricultural meteorology, and solar-terrestrial physics. Understanding multi-decadal rainfall cycles could improve long-term water resource planning in semi-arid regions of Brazil.
Next steps
Conduct an analysis of rainfall relationships with ITCZ and AMM indices on the same timescales. Investigate the spatial variability of rainfall and its connection to the general atmospheric circulation.
Key open problems
For climatology, the question remains open about the mechanisms that transmit the solar signal to the troposphere and ocean on decadal scales. It is also unclear how to separate natural multi-decadal variability from anthropogenic influence in regional rainfall. This work provides observational evidence of synchrony but does not reveal the physical mechanism, which remains a key problem.
The knowledge machine's view
This section is addressed to the author of the paper and their colleagues. Neighbouring works were found by meaning-based search across our archive, not by word overlap. We do not review: we show the field around the work.
What the work does
The study compares wavelet spectra of solar activity (Wolf numbers), SOI and PDO indices, and monthly precipitation at five stations in northeastern Brazil over 1933–2017. Common periods of 2.66, 5.33, 10.66, and 21.33 years are identified, with the 10.66- and 21.33-year periods appearing across all types of series. The authors interpret this as a possible solar modulation of regional hydroclimate.
Where its strength is
A strong point is the application of cross-wavelet and coherence analysis to long time series, which reveals not only common frequencies but also their synchronization over time, especially for the 11- and 21-year cycles.
Where it could go next
- It might be interesting to compare the found cycles with solar tidal rhythms, which are discussed in a neighboring paper: if solar activity is modulated by planetary tides, this would provide a physical mechanism for the observed periodicities.based on: The Sun's Tidal Rhythms arXiv:2602.11227
- Nearby is an analysis of ancient Martian climate swings, which examines cyclic climate changes driven by orbital and solar factors. Possibly, transferring methods or comparing with Martian paleoclimate series could help clarify how universal the found periods are.based on: The Climate Swings of Ancient Mars arXiv:2601.07159v2
Worth trying
- Test whether phase synchronization between the solar cycle and precipitation persists when using a sliding coherence window.
- Construct composite precipitation anomaly maps for phases of the 11-year cycle to identify regions with the strongest response.
- Compare precipitation wavelet spectra with indices of tidal forcing on the Sun, if such series are available.
Nearby works in our archive
- The Sun's Tidal Rhythmssimilarity 0.49
- The Full Reservoir Mirage: The Illusion of Abundance and Its Costsimilarity 0.47
- The Climate Swings of Ancient Marssimilarity 0.47
- Plant Life Could Last Over a Billion Yearssimilarity 0.46
- Dust Storms on a Rogue Planetsimilarity 0.45
The archive is sparse around this work: the closest review is only 0.49, against a usual 0.64. It looks like few have drilled nearby.
The sunspot cycle lasts on average 11 years, but over the past 80 years its length has varied from 8 to 17 years. Wavelet analysis allows you to see this period instability directly on the spectrogram.
Key numbers
- observation period for global indices: 993 months (82.75 years)
- main cycles: 2.66; 5.33; 10.66; 21.33 years
- observation period for rainfall: 801 months (66.75 years)
- number of rainfall stations: 5
- sunspot cycle: about 11 years (ranging from 8 to 17 years)