Power spectral density (PSD) describes how the power of a signal or time series is distributed across different frequencies. Instead of telling you the total power, it tells you how much power sits in each frequency band. This is essential for analyzing anything from sound waves to radio transmissions to quantum noise, because it reveals the underlying periodicities and random fluctuations that a simple average would hide.
History
The concept was formalized in the early 20th century, with Norbert Wiener (1930) and Alexander Khinchin (1934) independently proving the autocorrelation–PSD relationship. It became a standard tool in electrical engineering and physics after the rise of spectral analysis in the 1940s.
How it works
For a signal x(t), the PSD is computed via the Fourier transform: it is the squared magnitude of the transform, often normalized by time. For stationary random processes, the Wiener–Khinchin theorem states that the PSD is the Fourier transform of the autocorrelation function. In practice, you take a time series, break it into segments, compute their Fourier transforms, and average the squared magnitudes to reduce noise.
In practice
Used in telecommunications to design filters, in astrophysics to analyze cosmic microwave background fluctuations, in acoustics to characterize noise, and in quantum optics to study photon statistics.
Fun fact
The PSD of white noise is flat — it has equal power at all frequencies, which is why it sounds like a hiss and looks like a straight line on a spectrum analyzer.
Units by system: SI: whz · CGS: ergshz · Planck: e pt pf p
A superconducting qubit is like a finicky musical instrument: until you tune it, you won't get a clean note. But even after tuning, the pitch drifts. The culprits are tiny defects in the material that physicists call two-level systems. They're like invisible cracks that appear and disappear, throwing off the processor's rhythm.
A protein in a cell is not a frozen sculpture. It is constantly in motion: bending, breathing, jittering. This motion, its dynamics, determines how the protein works. But peering directly into the dance is hard, and computer simulations often demand enormous computing power.
A new approach, named DynaMode, views protein motion as a musical piece.
The Universe is a giant labyrinth of curved mirrors. The mass of galaxies and clusters distorts the light of distant quasars, as if toying with our perception of the cosmos. Hidden in this hall of mirrors is the key to the greatest mystery: dark energy, which is pushing space apart ever faster.
The cosmological constant is causing the universe to expand at an accelerating rate. In the far future, when all matter has dispersed, only empty de Sitter space will remain — an ideal cosmic backdrop.
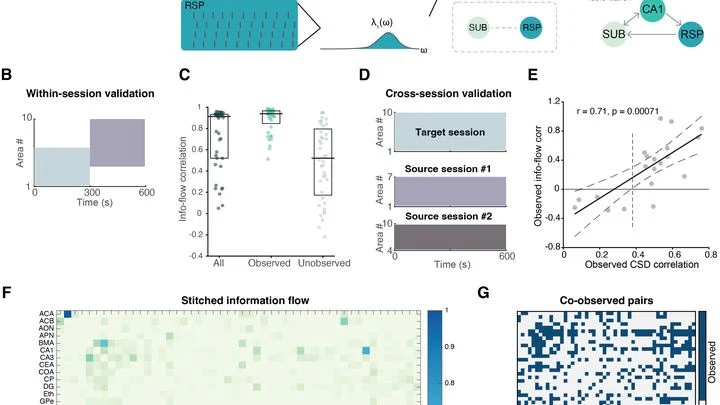
A patchwork quilt where each patch is a recording of activity from a small brain region. One patch was stitched on Monday in London, another on Tuesday in New York, and a third a month ago in Tokyo. This mosaic covers the brain only partially, and there is no common seam to join them.
The quantum world is full of surprises. In a Kerr parametric oscillator, a device where light is trapped in a ring and driven by an external field, researchers recently noticed something strange: pairs of energy levels merge in an embrace. Physicists have dubbed this a "spectral kiss" spectroscopy.