method

data analysis

The process of inspecting, cleaning, transforming, and modeling data to discover useful information.
12 related articles

Description

Data analysis is the systematic process of inspecting, cleaning, transforming, and modeling data to extract useful information, draw conclusions, and support decision-making. In modern science, it is the bridge between raw measurements and understanding: a particle detector produces millions of electronic signals, a telescope captures terabytes of images, and a climate model generates petabytes of output—none of which mean anything until they are processed, filtered, and interpreted. Data analysis encompasses everything from simple statistical summaries to complex machine learning algorithms that can identify patterns invisible to the human eye.

History

Data analysis has roots in the early 20th century with the development of statistical methods by figures like Ronald Fisher and Karl Pearson. The field expanded dramatically with the advent of computers in the 1950s and 1960s, and more recently with the rise of big data and machine learning in the 21st century.

How it works

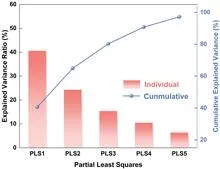
The process typically begins with data collection and cleaning, where errors, missing values, and outliers are identified and corrected. Next, exploratory analysis uses visualization and summary statistics to understand the data's structure. This is followed by modeling, where statistical or machine learning methods are applied to test hypotheses or make predictions. Finally, the results are validated and interpreted, often requiring domain expertise to distinguish genuine signals from artifacts. In many fields, this is an iterative loop, with initial findings guiding new questions and further data collection.

In practice

Data analysis is used in virtually every scientific discipline, from genomics (identifying disease-associated genes) to astrophysics (detecting exoplanets from light curves) to epidemiology (tracking and predicting disease outbreaks). It is also central to industry, finance, and technology, where it powers recommendation systems, fraud detection, and autonomous vehicles.

Fun fact

The term 'data analysis' was not commonly used until the 1960s; earlier, the field was simply called 'statistics' or 'data processing.'
Concept graph →

Related articles · 12

Optics That Fix Themselves
An orchestra of a hundred musicians plays without a conductor. Every instrument is tuned perfectly, but one violin goes slightly off, and the harmony falls apart.
Statistical ML2026-08-171 minarXiv:2608.16506express
How to See Shape When Data Are Unevenly Sampled
Two photographers shoot the same mountain. One takes a hundred shots from the summit and only a couple from the base; the other does the opposite. If you try to align their images, the algorithm might decide that the summit in one photo matches the summit in the other simply because there are many similar points there, not because it's the same spot. Sampling density throws it off.
Image Processing2026-07-151 minarXiv:2607.13601express
Video Instead of Dozens of Shots: Urine Analysis Made Easier
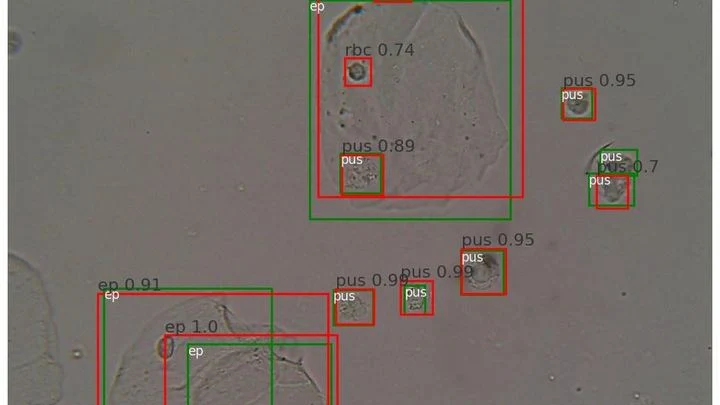
A drop of urine under a microscope isn't a flat puddle but a multi-layered volume. Like a stack of transparent pages: if you focus on one, the neighboring ones blur. The microscope's light only shows one depth layer sharply. To see all the cells, a lab technician had to take a series of snapshots, manually adjusting focus — tedious and slow.
eess.SY2026-07-131 minarXiv:2607.11459express
The Power Industry Opens Data for AI
A living power system is like an organism: power lines are vessels, current is blood. Data, however, are nerve impulses that used to be lost. mAIEnergy connects these 'nerves' to a shared 'brain'. This data repository combines satellite images, electricity meter readings, articles, and weather reports.
Materials2026-07-112 minarXiv:2607.10388
Symphony of Atoms: How AI Turned the Microscope into a Conductor of Matter
An electron microscope is a giant pipe organ: instead of pipes (electromagnetic lenses, instead of air) a stream of accelerated electrons. It once merely painted mute frescoes of the atomic world, condemning scientists to grueling decipherment.
How an AI Scientist Taught a Robot Fish to Swim
In the watery environment, vortices batter the mechanical fish. The AI agent, like an experimental chef, ran simulations, tried out 'recipes' of movements, and improved the program. Each experiment was like spectroscopy: the agent broke down behavior into elements, uncovering patterns. At first, the fish only paddled in one direction.
Materials2026-04-241 minarXiv:2604.22938express
How to Mine Data from Thousands of Papers
A library of 27,000 books, and every one of them is about concrete. Each contains a mix recipe, temperature, and strength. But the information is scattered across paragraphs, tables, and footnotes. For a human, gathering it all together would take years. The program did it in an hour.
Materials2026-03-142 minarXiv:2603.14139express
Hydrogen Under Control: A Database for New Materials
Hydrogen is a champion in energy per kilogram, but storing it is a hassle. As a gas, it takes up a huge volume, and if you compress it or cool it to a liquid, you need heavy tanks and lots of energy. There's a third way: some solid materials absorb hydrogen like a sponge soaks up water and hold it within. Heat it up, hydrogen comes out; cool it down, it gets absorbed back.
q-bio.QM2026-02-221 minarXiv:2602.19196express
The Hawk's Flight, Broken Down into Three Numbers
A hawk soars over a field, its wings tracing an intricate dance. Each flap, each tilt is not random but a combination of simple motions that can be broken down into components. Collective behavior in the air may seem intuitive, but behind it lies strict mechanics. Scientists recorded the hawks' movements using cameras that track the position of every point on the wing and tail.
How Ancient Weather Chronicles Came to Life
Old Chinese chronicles are full of weather entries: "no rain in the third month," "the river overflowed its banks." But these are words, not numbers. Until now, turning them into precise precipitation data was nearly impossible. The new approach works like a translator from the language of chronicles to the language of climatology.
Optics2026-01-181 minarXiv:2601.12404express
A Laser That Obeys Randomness
A random fiber laser is a thin glass thread through which light travels, but instead of reflecting off mirrors, it reflects off the tiniest irregularities in the fiber itself. Such a laser doesn't produce a steady beam: its light flickers and flares like a candle flame in a draft.
stat.ME2022-05-192 minarXiv:2205.09252
Breaking Point in the Flow of Functions
A seismograph records underground tremors: the smooth line suddenly jerks and changes its character. Similarly, functional data, such as ocean temperature maps or brain signals, may shift their shape at some point. The new algorithm FSBS catches such breakpoints, even when each curve is measured at only one point and noise drowns the signal.