Neural Network Reads the Ocean: How Water Temperature Predicts the Winter Character of the Atlantic ✛
Context
This work sits at the intersection of climate science and machine learning, alongside research on El Niño predictability, ocean circulation, and neural-network weather forecasting. Related papers on the archive cover El Niño prediction up to a year and a half ahead, the stability of the ocean conveyor belt, and lightweight AI for space communications. This study stands out by focusing on a specific task: predicting the early-winter NAO index from sea surface temperature alone, without atmospheric fields, using a convolutional neural network with sensitivity analysis for interpretation. It continues the line of research on the ocean's role in atmospheric variability, but with an emphasis on nonlinear links that dynamical models reproduce poorly.
Methods
For training, they used ERA5 reanalysis data from 1940 to 2023. The NAO index was defined as the first principal component of sea-level pressure anomalies over the North Atlantic (20°–70°N, 100°W–40°E), explaining 22.4% of the variance. Sea surface temperature was taken over the region 15°S–70°N at 1°×1° resolution. The network input consisted of three temperature anomaly maps: one, two, and three months before the target season (November–December). The architecture included three convolutional blocks with circular convolution over longitude, batch normalization, and ReLU activation, followed by a fully connected layer. For comparison, they built a linear model with the same architecture but without nonlinear activations and with average pooling instead of max pooling. Training and validation used leave-one-year-out cross-validation (LOOCV), hyperparameters were tuned on 1940–1949, and metrics were computed on 1950–2023. For interpretation, they used gradient-based sensitivity maps with bootstrap significance testing.
Results
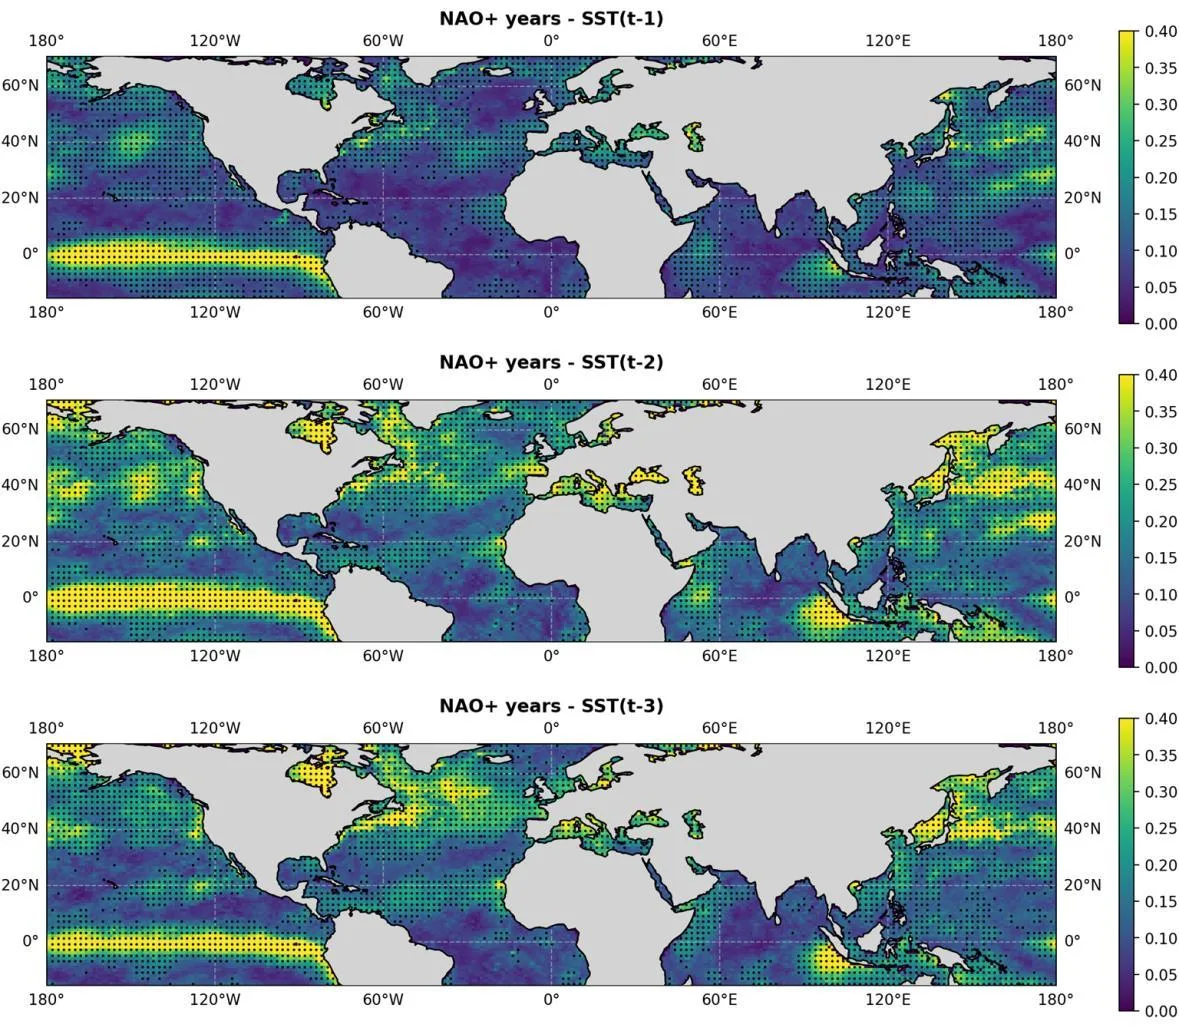
Over the full period 1950–2023, the convolutional neural network achieved a normalized root mean square error (nRMSE) of 0.88 and a correlation coefficient of 0.50, while the linear model scored 0.92 and 0.44, respectively. Both results are statistically significant at the 95% level. When split by El Niño intensity (Niño3.4 index), the network in years of moderate and strong ENSO reached a correlation of 0.57 and nRMSE 0.86, while in weak and neutral years it scored 0.46 and 0.90. The linear model showed a smaller contrast: 0.47 and 0.91 versus 0.43 and 0.93. Sensitivity maps revealed that the network relies on the equatorial Pacific, the North Atlantic (especially the North Atlantic Current region and Hudson Bay), and the Indian Ocean near the Mentawai Islands. For negative NAO phases, sensitivity was weaker than for positive phases.
Implications
The study shows that a simple convolutional neural network, trained only on sea surface temperature, can predict the early-winter NAO index better than its linear counterpart, especially during strong El Niño. This confirms that nonlinear ocean–atmosphere interactions, which climate models reproduce poorly, can be partially captured by statistical deep-learning methods. Unlike related works that either use complex full models or focus on other indices, here they achieve a medium-range forecast (about 10 days of effective lead time) with a compact architecture and explainable sensitivity analysis. This underscores the value of interpretable machine learning for diagnosing physical mechanisms.
Future development
A promising direction is replacing mean squared error with quantile regression, so the model does not underestimate forecast spread and better captures extreme NAO phases. It is also worth investigating why the number of well-predicted cases has decreased since 2001: possibly the positive phase of Atlantic Multidecadal Variability suppresses the ENSO–NAO link. Adding other predictors, such as sea ice cover or stratospheric parameters, could improve forecasts in neutral years.
Impact
The results could benefit Europe's energy and agriculture sectors, where winter weather strongly depends on the NAO. The method is also applicable to forecasting other atmospheric indices from oceanic fields.
Next steps
Test the model on independent data from other reanalyses and on real-time forecasts. Investigate the influence of Atlantic Multidecadal Variability on NAO predictability in recent decades.
Key open problems
Connection to unsolved problems in climate science: why dynamical models underestimate the NAO response to sea surface temperature anomalies, especially in early winter, and what role nonlinear interactions play in this teleconnection. The study does not solve these questions but offers a statistical tool for diagnosing them.
The knowledge machine's view
This section is addressed to the author of the paper and their colleagues. Neighbouring works were found by meaning-based search across our archive, not by word overlap. We do not review: we show the field around the work.
What the work does
The authors trained a convolutional neural network on sea surface temperature from ERA5 (1940–2023) to predict the wintertime NAO index from anomaly maps taken 1–3 months before the season. The network outperformed a linear model, especially in years of strong El Niño, and sensitivity analysis revealed reliance on the tropical Pacific, the North Atlantic, and the Indian Ocean.
Where its strength is
A key strength is the successful application of deep learning to a specific task: predicting the NAO from ocean temperature alone, with interpretation via gradient maps, which opens the way to understanding nonlinear connections.
Where it could go next
- It would be interesting to see how the sensitivity-analysis interpretation approach could be applied to forecasting El Niño a year and a half ahead: your network already highlights the tropical Pacific as a key region, and comparing with models that predict ENSO could clarify which oceanic patterns matter at different lead times.based on: El Niño Can Be Predicted a Year and a Half in Advance arXiv:2601.12251
- Closely related is work on how a neural network, reading weather backward, warns of drought months in advance: perhaps your architecture with circular convolution and sensitivity analysis could be adapted to forecast other atmospheric indices or extreme events using only oceanic predictors.based on: How a neural network, reading weather backwards, warns of drought months in advance arXiv:2607.00331
- It might be interesting to compare your model with approaches that look into the 'mind' of weather AI: your sensitivity maps already show what the network relies on, and methods from that work could help interpret nonlinear responses more deeply, especially for negative NAO phases.based on: Peeking Inside the Mind of a Weather AI arXiv:2604.20467
Worth trying
- Try adding ocean temperature at greater depths or upper-ocean heat content as inputs to strengthen the signal for negative NAO phases.
- Test whether forecasts improve when using an ensemble of neural networks with different initializations to assess prediction uncertainty.
- Apply the trained model to climate model data (e.g., CMIP6) to see how well the nonlinear relationships learned from reanalysis are reproduced in models.
Why this may matter
The work shows that deep learning can extract predictive information from the ocean for atmospheric variability, which is important for improving seasonal weather forecasts in Europe and for understanding the ocean's role in the climate system.
Nearby works in our archive
- El Niño Can Be Predicted a Year and a Half in Advancesimilarity 0.59
- The Ocean Conveyor on the Brinksimilarity 0.54
- How a neural network, reading weather backwards, warns of drought months in advancesimilarity 0.50
- An Underwater Hunter for Earth's Heatsimilarity 0.50
- Neural Network Reads the Future of Plasmasimilarity 0.50
- Peeking Inside the Mind of a Weather AIsimilarity 0.48
The archive is sparse around this work: the closest review is only 0.59, against a usual 0.64. It looks like few have drilled nearby.
The neural network, with 262,225 trainable parameters, matches the accuracy of seasonal forecasts that use supercomputer models of the atmosphere and ocean. Yet it was trained on just 250 independent 'pictures' of the ocean.
The idea of reading the future from ocean temperature evokes Frank Herbert's 'Dune', where navigators use complex calculations to foresee their path. Here, the convolutional network plays the navigator, and the path is Europe's winter weather.
Key numbers
- neural network nRMSE: 0.88
- neural network correlation: 0.50
- correlation in strong ENSO years: 0.57
- trainable parameters: 262,225
- NAO explained variance: 22.4%