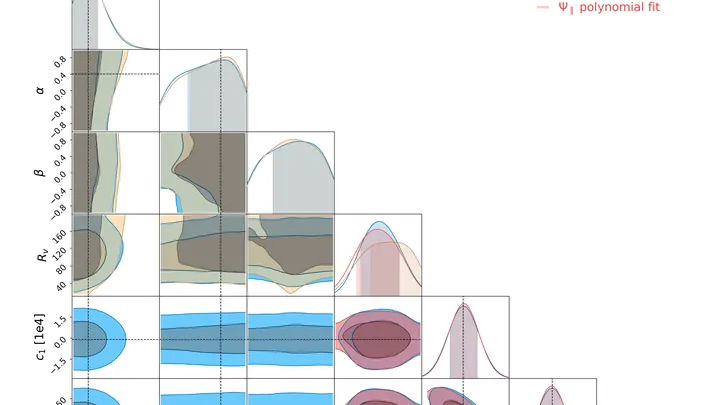
A covariance matrix is a square matrix that summarizes how multiple variables vary together. Each diagonal entry gives the variance of a single variable — how much it spreads around its mean — while each off-diagonal entry gives the covariance between two variables, indicating whether they tend to increase or decrease together. For a set of n variables, the matrix is n×n, and it is symmetric because the covariance between variable A and B is the same as between B and A.
History
The concept of covariance was formalized by Karl Pearson in the late 19th century, and the matrix form became standard in multivariate statistics during the 20th century.
How it works
To build the matrix, you compute the average of the product of deviations from the means for each pair of variables. If two variables move in the same direction, their covariance is positive; if opposite, negative; if unrelated, near zero. The matrix compactly encodes all pairwise relationships, and its eigenvalues and eigenvectors reveal the principal directions of variation in the data — the basis of principal component analysis.
In practice
It is used in machine learning for dimensionality reduction, in finance for portfolio risk assessment, and in physics for analyzing correlated measurements in experiments.
Fun fact
The covariance matrix of a multivariate normal distribution completely determines the shape and orientation of its probability cloud, from a sphere to a stretched ellipsoid.
Two daughter cells receiving equal shares from the mother: that's the familiar picture of division. But what if one gets almost everything and the other just crumbs? Stochastic modeling shows that sometimes unequal division is more advantageous.
Each cell stores a protective reserve that helps it weather hardships. During division, this reserve is distributed between daughters.
Inflation is the rapid expansion of the newborn Universe, when quantum fluctuations were stretched to cosmic scales. The cosmic microwave background is the fossilized light of that epoch, shadows on the wall of our cosmic cave.
Eight hundred participants, firms and workers, enter the market. Each holds a strict preference list in mind. The challenge: pair up so that no one wants a do-over. In mathematics, this is called a game theory with a ban on repeat alliances, and its roots trace back to the work of John von Neumann and Oskar Morgenstern.
A billiard ball strikes another, and the sum of their velocities before and after the collision obeys strict rules. The same happens in the microscopic world: energy, momentum, and charge cannot simply vanish.
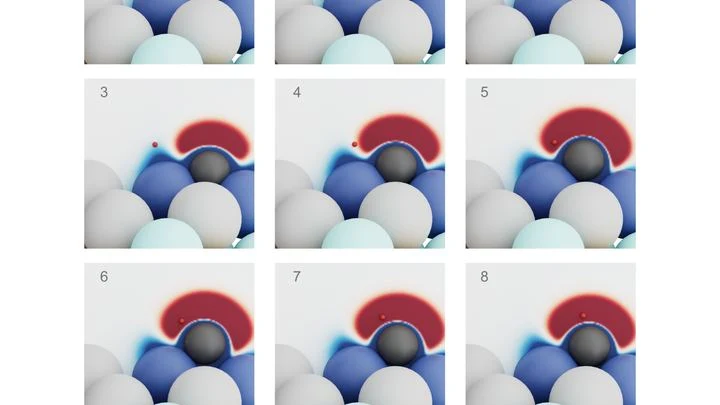
A kitchen sponge soaked in syrup: in some spots there's more syrup, and your finger sticks right away; in others, it barely touches. That's roughly how a catalyst surface works. Molecules don't react everywhere but at especially sticky points — active sites.
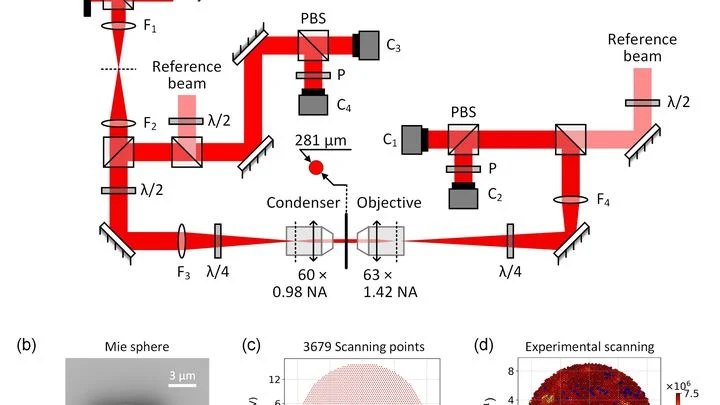
A flashlight beam in fog breaks into thousands of faint specks. Each speck is light that has bounced off countless water droplets before reaching your eye. To make sense of this mess, physicists construct a special table — the scattering matrix. It records how each incoming ray turns into a set of outgoing ones.
Galaxies in the Universe are not scattered randomly: neighboring ones move in the same direction, like a school of fish, while distant ones each go their own way. Where the boundary between 'together' and 'apart' lies has been unclear until now.
A fractal that looks like a butterfly hides an order that is not visible at first glance. In the quantum world of one-dimensional quasicrystals described by the Komoto model, the energy spectrum forms a whimsical shape: the Komoto butterfly.
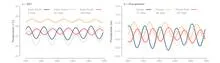
In 1960, a meteorologist at a station in Peru records water temperature, while a farmer in India watches the sky waiting for the monsoon. There is no direct link between these two events, but months later one will echo in the other.