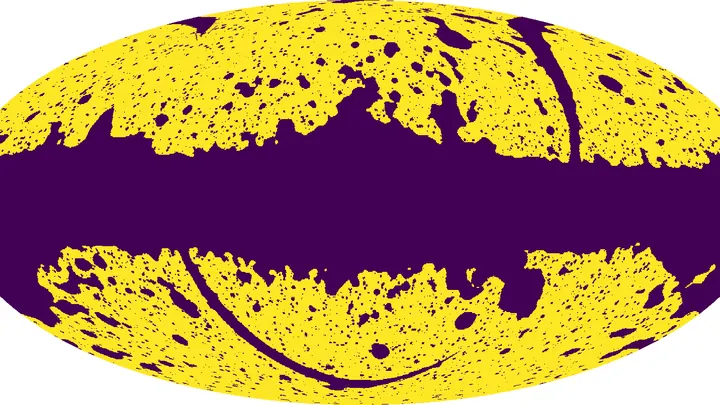
Cross-correlation is a statistical method that measures the similarity between two datasets as one is shifted relative to the other. It is used to find patterns that appear in both datasets, even if they are offset in time or space. In the context of sky maps, cross-correlation helps astronomers compare maps of different cosmic signals—like temperature fluctuations and galaxy distributions—to see if they share common features, which can reveal underlying physical connections.
History
The concept of cross-correlation has roots in early 20th-century statistics and signal processing, with formal development by statisticians like Norbert Wiener in the 1940s, though similar ideas appeared earlier in time-series analysis.
How it works
Given two sequences or maps, cross-correlation computes a value for each possible shift: it multiplies the values at corresponding positions, sums the products, and repeats for every shift. A high value at a particular shift indicates that the two datasets align well when offset by that amount. In practice, for large datasets like sky maps, this is often done efficiently using Fourier transforms, where cross-correlation becomes a simple multiplication in frequency space.
In practice
Cross-correlation is widely used in astronomy to compare cosmic microwave background maps with galaxy surveys, in engineering for radar and sonar signal detection, and in finance to analyze relationships between economic time series.
Fun fact
Cross-correlation is the mathematical basis behind how your smartphone's GPS receiver locks onto satellite signals by matching the incoming signal with a known code.
The orchestra plays without a conductor. Each instrument follows its own schedule: the violin on Monday, the flute on Wednesday, the timpani on Saturday. Astronomers hear not music but isolated notes scattered across the calendar. A telescope sees a star only when it is above the horizon and when the schedule has allotted time for it.
380 thousand years after the Big Bang, the universe cooled enough for light to decouple from plasma. That cosmic microwave background still pervades space, like the first chord of a symphony, the echo of a fiery beginning.
Statistical models are an attempt to stretch a perfect mathematical web over the uneven landscape of data. When a model resists, it emits tension, but we've grown accustomed to ignoring it. Researchers spend hours staring at residual plots, trying to guess where the model is 'coming apart at the seams.' Squealer translates this resistance into sound.
Two sensitive microphones are listening to the Universe. One hears a low hum, the other hears almost nothing. It's not a malfunction: it's about how they are oriented.
Gravitational-wave observatories like LIGO don't just catch loud bursts from black hole mergers.
A census that only records the distance between houses misses a lot. You can tell where the cities are and where the villages are, but you can't distinguish a skyscraper from a single-family home. That's roughly how astronomers study the universe with the standard two-point correlation function: they count how many pairs of galaxies are separated by a given distance.
A stone falls into a well, and the splash reaches your ears with a delay. Something similar happens to light as it leaves Earth: its oscillations become less frequent, the beam seems to 'tire.' This is gravitational redshift — a phenomenon Einstein spoke of a century ago.
The heart beats, and on a paper ECG strip, each beat looks like a sharp spike with two humps: a quick rise, then a smaller wave, then a descent. A doctor looks at such a strip and sees the rhythm, but the shape of each spike, how exactly the muscle contracted, is hard to discern, especially if the recording lasts a full day.
This new method turns that strip into a colorful carpet.
For the first few hundred million years after the Big Bang, the universe was dark: there were no stars yet, and space was filled with cold hydrogen. This gas emits radio waves at a wavelength of 21 centimeters — like a quiet whisper that reaches us across 13 billion years.
The Universe is expanding, and every galaxy cluster takes part in a grand dance. The tempo of this dance is set by the Hubble constant, first measured by Edwin Hubble nearly a century ago. Pinpointing the number is tough because you need a ruler that spans billions of light-years.
Imagine a border river that separates two countries. On one bank live one group of people, on the other, another. The boundary between them is not always obvious: in some places the river is wide and calm, in others narrow and turbulent. But it is exactly where the current changes abruptly that the border becomes most noticeable.
A translator who hears only the meaning, not the noise in the hall, can convey a conversation accurately. Climatologists have long sought such a translator for the ocean–atmosphere pair: their interaction resembles a dialogue where voices drown in the roar of extraneous sounds.