A spectrum is the distribution of a physical quantity — such as particle flux, light intensity, or sound power — as a function of energy, frequency, or wavelength. In physics, the term is most often associated with electromagnetic radiation: the familiar rainbow of visible light is just the narrow slice of the electromagnetic spectrum our eyes can detect. But the concept extends far beyond light: cosmic-ray spectra show how many particles arrive at each energy, and the spectrum of a star's X-ray emission reveals the temperature and composition of its outer layers.
History
Isaac Newton first used a prism in 1666 to show that white light is composed of colors, but the modern quantitative concept of a spectrum emerged in the 19th century with Joseph von Fraunhofer's observation of dark lines in the solar spectrum and Gustav Kirchhoff's work on emission and absorption spectra.
How it works
To produce a spectrum, you separate a mixed signal into its components by some physical property. A prism or diffraction grating spreads light by wavelength; a particle detector measures the energy of each incoming particle and tallies the counts. The result is a plot or histogram showing how much of the quantity exists at each energy or frequency. The shape of that curve — whether it peaks, falls off steeply, or shows sharp lines — carries information about the processes that generated the signal.
In practice
Spectra are used everywhere from astronomy (identifying elements in distant stars) to medicine (MRI and spectroscopy for tissue analysis) and telecommunications (frequency allocation for radio and Wi-Fi).
Fun fact
The word 'spectrum' comes from the Latin for 'apparition' or 'ghost' — Newton used it to describe the colored image that appeared after light passed through a prism.
A flashlight beam cuts through fog. The denser the fog, the more the light scatters and the later it reaches your eye. A similar principle works with fast radio bursts — mysterious, super-powerful pulses from distant galaxies. As their radio waves travel through space, they interact with free electrons — particles stripped from atoms.
Moments before totality, swift shadow bands glide across the ground, like ripples from pebbles tossed into water. For centuries, this phenomenon baffled scientists. It turns out the key is that light is a wave.
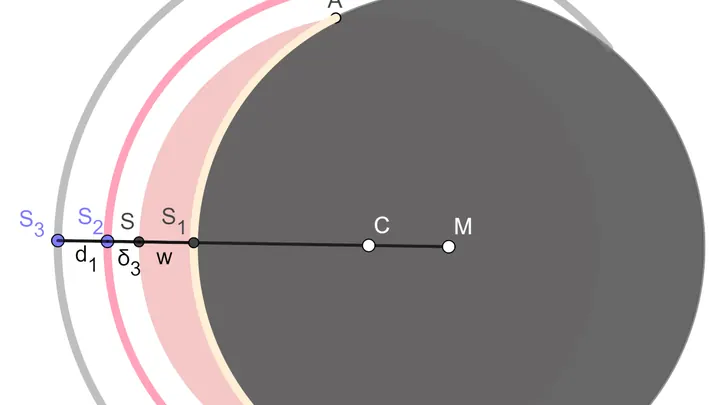
The Sun isn't a pinpoint lamp but a vast disk. When the Moon nearly covers it, a thin glowing crescent remains.
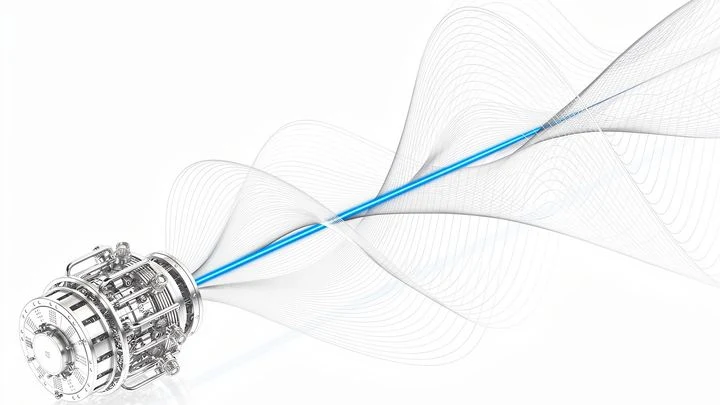
When an electric charge moves with acceleration, it emits electromagnetic radiation, i.e., light — a familiar phenomenon in physics. However, researchers have found that when moving along a specially chosen trajectory, the radiation acquires unusual properties.
A charged particle spiraling in a magnetic field doesn't stay silent: it emits light. This light is called synchrotron radiation, and it shows up everywhere — from distant galaxies to laboratory accelerators.
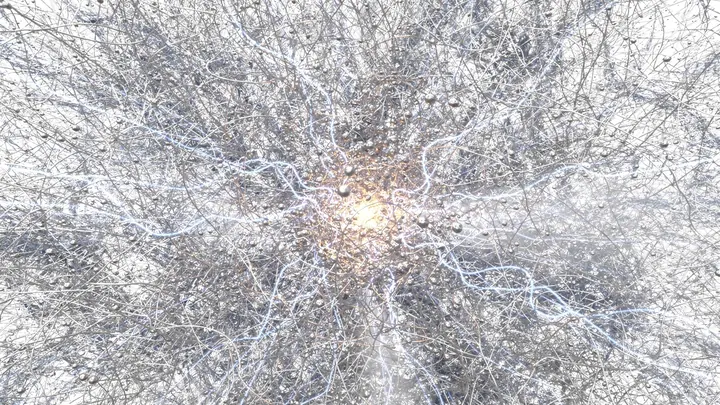
At night over the Siberian taiga, a faint blue light sometimes flickers. It's not the aurora borealis but a cosmic-ray shower: a single particle from deep space slams into the atmosphere and shatters into millions of secondary particles. They race toward the ground in a broad front, like a ripple from a stone dropped into water, and make the air glow.
In the quiet harbor of the Local Bubble, a rarefied cavity of hot gas around the Sun, an explosion recently thundered. A supernova went off tens of parsecs away, and its echo still lingers in the neighborhood, reshaping the cosmic-ray landscape.
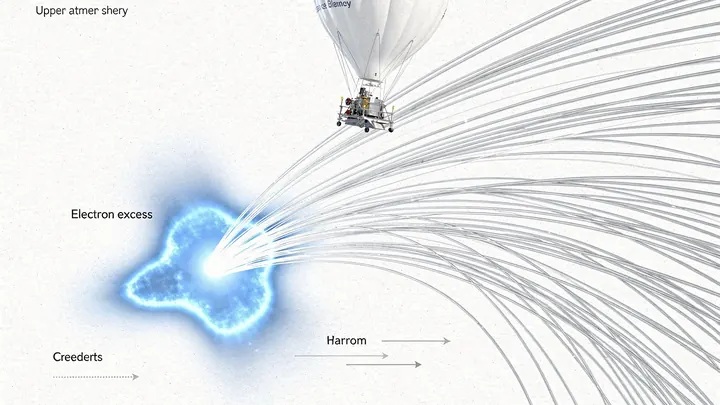
High above Antarctica, a balloon carried an instrument that caught electrons from space. These particles come from distant stellar explosions and other powerful events. The instrument measured their energy, like the force of an impact. And in one energy range, there were more impacts than calculations predicted.