Goodness of fit is a statistical measure of how well a model's predictions match observed data. In physics, it is used to judge whether a theoretical curve, a simulation, or a combination of model components adequately explains experimental measurements. A high goodness of fit means the model captures the essential features of the data, while a low value suggests missing physics, systematic errors, or an inappropriate model.
History
The concept emerged in the late 19th century with Karl Pearson's chi-squared test (1900), which formalized the comparison of observed frequencies to expected ones. It became a standard tool in physicsdata analysis in the 20th century.
How it works
The most common quantitative measure is the chi-squared statistic, which sums the squared differences between observed and predicted values, each weighted by the uncertainty. A reduced chi-squared near 1 indicates a good fit; much larger values signal underfitting or underestimated errors, and much smaller values can indicate overfitting or overestimated errors. Other metrics like the coefficient of determination (R²) or likelihood-based criteria are also used depending on the context.
In practice
Used in particle physics to validate the Standard Model against collider data, in astrophysics to fit galaxy rotation curves, and in any experiment where a model is compared to measurements.
Fun fact
In particle physics, a 'good' fit often requires a reduced chi-squared between 0.8 and 1.2, but a value exactly 1.0 is so rare that it sometimes raises suspicion of data fabrication.
Gravity isn't just the force that keeps us on the floor. On cosmic scales, it conducts galaxies, bends light rays, and decides the fate of everything. A century ago, Einstein described it as the curvature of space and time.
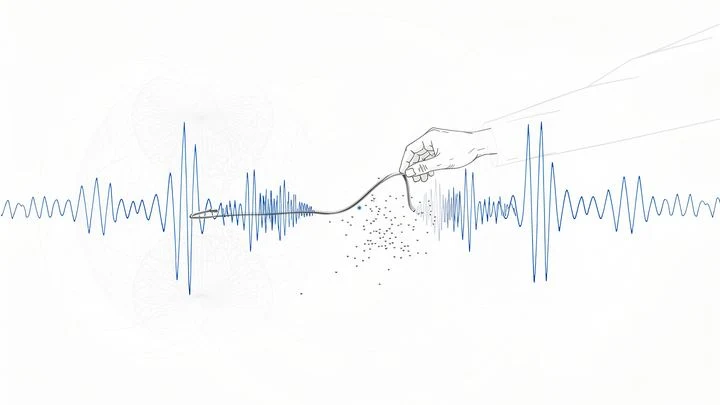
Statistical models are an attempt to stretch a perfect mathematical web over the uneven landscape of data. When a model resists, it emits tension, but we've grown accustomed to ignoring it. Researchers spend hours staring at residual plots, trying to guess where the model is 'coming apart at the seams.' Squealer translates this resistance into sound.
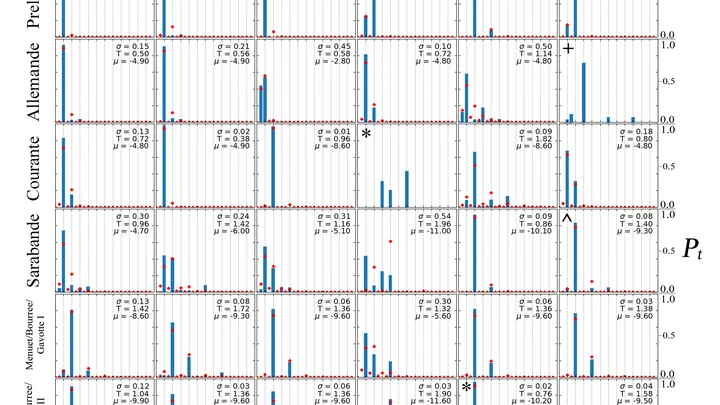
Music relies on repetition: we expect the beat to return, like a chorus coming back. But if you repeat the same thing for too long, it gets boring. The composer seems to walk a tightrope between the familiar and the unexpected.
Scientists translated this balance into the language of physics.
Quantum computers use GKP states, dreamed up by Alexei Kitaev, John Preskill, and Daniel Gottesman. Their hallmark is built-in stabilizer checks that catch errors. For a long time, it was believed that a successful check guaranteed a nearly perfect state. Alas, it's an illusion.
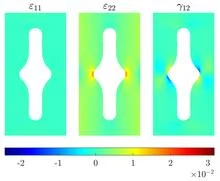
A mechanical testing lab is like a kitchen where a chef tastes a dish to guess the recipe. For an anisotropic material, one that is stiffer along its fibers than across them, a single taste is not enough. You need three or more separate tests, each with its own specimen. Engineers have spent years refining specimen shapes by hand, relying on intuition and experience.