Mountain Trails of Quantum Phases
In a mountain range, there are trails that can be contracted to a point if you walk through a flat valley. But there are also loop routes that cannot be shrunk without crossing a ridge.
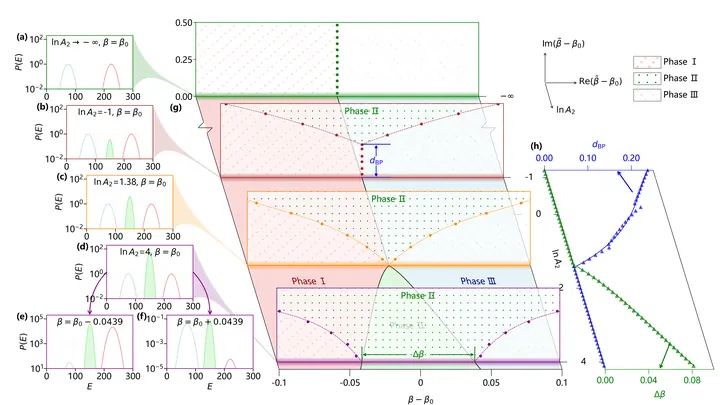
A graphical representation of the states of a system as a function of external parameters like temperature and magnetic field.A phase diagram is a graphical representation that shows the states of a system — such as solid, liquid, gas, or more exotic phases like superconducting or magnetic — as a function of external parameters like temperature, pressure, or magnetic field. The diagram divides parameter space into regions where each phase is stable, with lines marking the boundaries where two phases coexist. In physics, phase diagrams are essential for understanding how matter behaves under different conditions, from everyday water to quantum materials and even the early universe.
The concept of phase diagrams emerged in the 19th century with the work of Josiah Willard Gibbs, who introduced the idea of phases and chemical potential. The first detailed phase diagram for water was developed by Thomas Andrews in 1869, who identified the critical point.
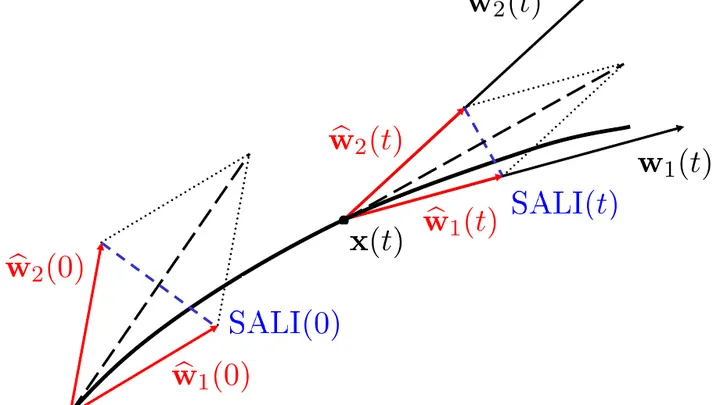
A phase diagram is constructed by measuring or calculating the free energy of each possible phase as a function of the external parameters. The phase with the lowest free energy is the stable one. Boundaries occur where two phases have equal free energy, leading to coexistence. Near critical points, fluctuations become large and universal behavior emerges, often described by power laws. Modern techniques, such as machine learning, can also identify phase boundaries from data, as hinted by 'How to distinguish chaos from order by the trace of a particle'.
Phase diagrams are used to design alloys with desired properties, to optimize industrial processes like crystallization, and to understand the behavior of materials in extreme conditions, such as in nuclear reactors or planetary interiors.
Water's phase diagram has at least 18 known crystalline phases of ice, some of which exist only at pressures thousands of times atmospheric pressure.