The frequencyspectrum is a representation of a signal that shows how much of its energy lies at each frequency. Instead of looking at a signal as it changes over time, the spectrum decomposes it into a sum of pure sine waves of different frequencies, revealing the 'fingerprint' of the signal. This is fundamental to understanding everything from the light emitted by distant stars to the electrical activity of the brain, as each source has a characteristic spectral signature.
History
The concept originates from Joseph Fourier's work on heat conduction in the early 19th century, where he showed that any periodic function could be expressed as a sum of sines and cosines.
How it works
The mathematical tool behind the frequencyspectrum is the Fourier transform, which takes a time-varyingsignal and expresses it as a sum of sinusoidal components. The amplitude of each component tells you the strength of that frequency in the original signal. In practice, for digital signals, the fast Fourier transform (FFT) algorithm computes this efficiently, allowing real-time spectral analysis.
In practice
Frequencyspectra are used in radio astronomy to identify the chemical composition of interstellar clouds, in medical EEG to diagnose brain disorders, and in telecommunications to allocate bandwidth and filter noise.
Fun fact
The 'spectral effect of a butterfly' in thick branes, mentioned in one of the titles, refers to how tiny changes in initial conditions can lead to vastly different spectral outcomes in certain physical systems, echoing chaos theory.
A cartographer receives a sheet with distances between hundreds of unnamed islands. No island is labeled, but the distances repeat, forming triangles and quadrilaterals. From these repetitions, the cartographer reconstructs the map of the archipelago, not knowing which island is which. This is roughly how the new work in molecular spectroscopy works.
A flashlight beam cuts through fog. The denser the fog, the more the light scatters and the later it reaches your eye. A similar principle works with fast radio bursts — mysterious, super-powerful pulses from distant galaxies. As their radio waves travel through space, they interact with free electrons — particles stripped from atoms.
Throw a stone into water: right at the point of impact, the waves are chaotic — that's the near field. Farther out, they spread in smooth circles — the far field. This same principle governs antennas for terahertz communications — the future of super-fast internet.
In fast-moving vehicles, mobile internet slows down: the signal, traveling at the speed of light, blurs like the scenery outside the window. Engineers have found a way to pack data more densely without letting them mix up. It's like a multi-lane highway where packet-cars drive not with a safe interval, but almost bumper-to-bumper.
A protein in a cell is not a frozen sculpture. It is constantly in motion: bending, breathing, jittering. This motion, its dynamics, determines how the protein works. But peering directly into the dance is hard, and computer simulations often demand enormous computing power.
A new approach, named DynaMode, views protein motion as a musical piece.
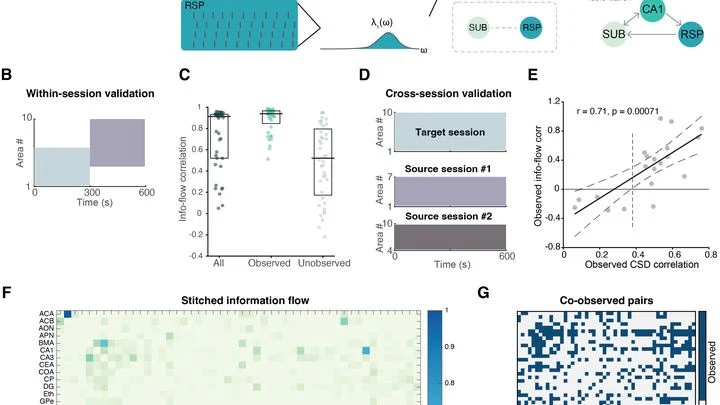
A patchwork quilt where each patch is a recording of activity from a small brain region. One patch was stitched on Monday in London, another on Tuesday in New York, and a third a month ago in Tokyo. This mosaic covers the brain only partially, and there is no common seam to join them.
When the conductor leaves the orchestra, the musicians keep playing from memory for a while. But without a unified rhythm, each one starts to speed up or slow down on their own, and the harmonious symphony turns into disjointed noise. According to new research, the brain and heart behave much the same way in the last hours of a person's life.
Gravitational wave detectors work like sensitive microphones, picking up the trembling of space from distant cosmic catastrophes. When two black holes merge into one, the newborn object rings like a bell, and that ringing is a unique 'voice' of gravity.
Hot massive stars are the kitchens of the Universe, where heavy elements are cooked up. They end their lives in supernova explosions. To understand their recipe, astronomers use spectroscopy — the analysis of the rainbow band of light passed through a prism. Previously, deciphering such a 'menu' took hours.
The light an atom emits is not just a flash. It carries an imprint of the atom's state at the moment of emission. Physicists took a superconducting qubit, an artificial atom the size of a microchip, and made it glow into an open waveguide, like a bulb in a long corridor.
The heart beats, and on a paper ECG strip, each beat looks like a sharp spike with two humps: a quick rise, then a smaller wave, then a descent. A doctor looks at such a strip and sees the rhythm, but the shape of each spike, how exactly the muscle contracted, is hard to discern, especially if the recording lasts a full day.
This new method turns that strip into a colorful carpet.
Infrared light with a wavelength of about three micrometers is the working range for identifying molecules: each molecule absorbs light at its own characteristic frequencies, leaving behind "fingerprints." But until now, instruments for this range could not simultaneously provide broad frequency coverage, sufficient power, and…
A fractal that looks like a butterfly hides an order that is not visible at first glance. In the quantum world of one-dimensional quasicrystals described by the Komoto model, the energy spectrum forms a whimsical shape: the Komoto butterfly.