Empirical orthogonal functions (EOFs) are a way to break down a complex, multidimensional dataset—like global temperature maps over time—into a few dominant patterns. Each EOF is a spatial pattern that varies coherently, and it comes with a time series showing how that pattern strengthens or weakens over time. The method is essentially principal component analysis applied to geophysical data, but the name 'EOF' is standard in atmospheric and oceanographic sciences.
History
The technique was popularized in meteorology by Edward Lorenz in the 1950s, though the underlying linear algebra was known earlier.
How it works
You take a data matrix where rows are time points and columns are spatial locations. The EOFs are the eigenvectors of the covariance matrix of this data, ordered by how much variance they explain. The first EOF captures the most variance, the second captures the most of the remaining variance while being orthogonal (uncorrelated) to the first, and so on. The corresponding time series (principal components) are obtained by projecting the original data onto each EOF.
In practice
Widely used in climate research to identify patterns like El Niño–Southern Oscillation from sea surface temperature data, and to reduce dimensionality before further analysis.
Fun fact
EOFs are not unique in sign—you can flip the pattern and its time series together and still get the same result, which sometimes leads to confusion when comparing studies.
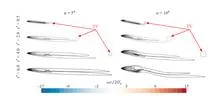
An airplane wing, like a skier on a ski jump, remembers its acceleration. Change the angle of attack sharply, and the lift does not immediately reach its new value. It builds up gradually, as if the wing is not yet sure the maneuver is for real.
This effect was discovered by engineer Herbert Wagner in 1925.
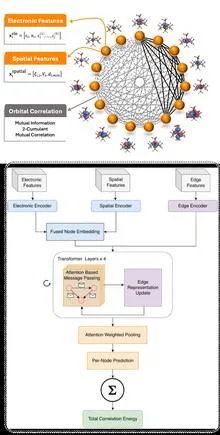
A cartographer who draws not mountains and rivers but invisible bonds between electrons: that's one way to describe the new neural network. Instead of atomic coordinates, it takes molecular orbitals and draws a graph where nodes are orbitals and edges are measures of their quantum entanglement.
Two photographers shoot the same mountain. One takes a hundred shots from the summit and only a couple from the base; the other does the opposite. If you try to align their images, the algorithm might decide that the summit in one photo matches the summit in the other simply because there are many similar points there, not because it's the same spot. Sampling density throws it off.
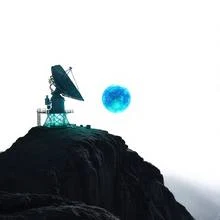
Two black holes, caught in a dance, spiral closer and closer until they merge into one. This dance is not silent: it shakes spacetime itself, sending gravitational waves rippling across the Universe. To understand what we hear in these waves, we need a precise mathematical model of the dance.
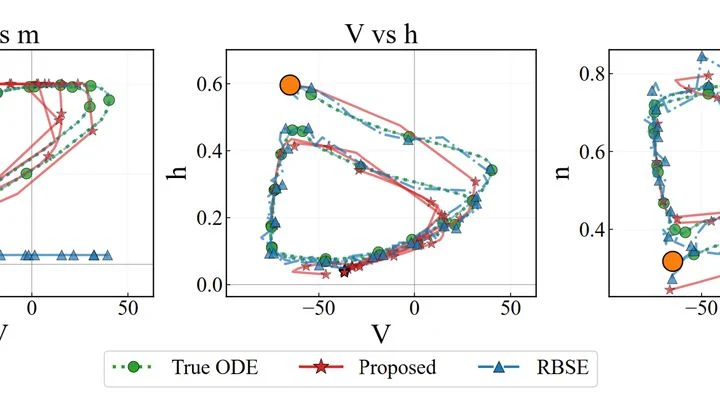
Many natural processes are described by differential equations, but scientists often have only fragmentary data — a sort of torn map. The new computational method works like a cartographer who reconstructs a complete map of the terrain from a few landmarks.
An orchestra plays in a dark hall, and the listener hears only a hum: hundreds of instruments blend into a dense noise in which no melody can be discerned. That is roughly what spectra extracted from climate data by methods like the Koopman operator look like: hundreds of components, each with its own frequency, and it is unclear which ones are true musicians and which are the rattling of chairs.
The quantum world does not like being pinned down to exact numbers. Physicists usually expand a complex interaction into a long series, like a sum of ever-smaller corrections.
When a person breathes, air doesn't flow in a steady stream but in waves. Previously, doctors and scientists only looked at overall numbers: how much air entered per breath, what the peak flow was. But within a single breath, there are nuances — small variations that speak to the workings of nerves and muscles. The new approach breaks a breath into parts, much like a musician breaks a chord into individual notes.
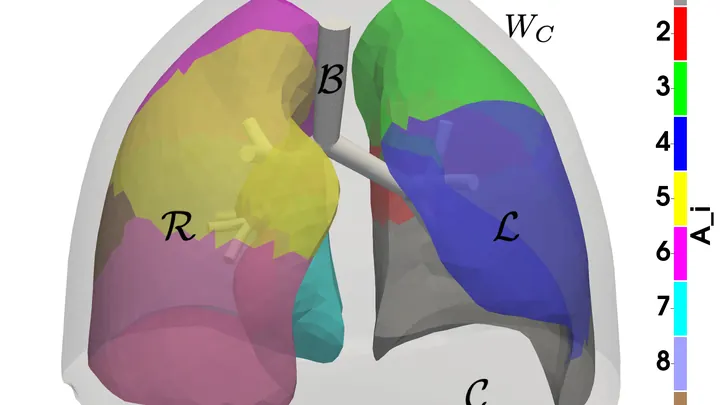
A lung scan reveals a tree: the trunk is the trachea, branches are the bronchi, and leaves are the alveoli. But how does air spread through these branches? Scientists built a computer model that replicates the lung's shape from images obtained via computed tomography.
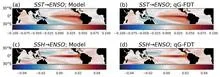
Every few years, the warm current off the coast of Peru shifts, and fishermen come home empty-handed. This is El Niño, the breath of the tropical Pacific, which affects weather from Indonesia to California. Predicting its arrival is as hard as predicting where a stone thrown into a raging river will roll.
Old weather records hold surprises: the thermometer suddenly jumps by half a degree, not because of the weather, but because the station switched instruments. Such abrupt shifts in data are called changepoints, and separating them from genuine climate signals is a challenge statisticians grapple with.
In 1960, a meteorologist at a station in Peru records water temperature, while a farmer in India watches the sky waiting for the monsoon. There is no direct link between these two events, but months later one will echo in the other.
The orchestra has been playing in the Pacific Ocean for over a century. Some instruments carry a fast melody, others draw out a slow bass line, and together they create a pattern of warm and cold patches on the water's surface.
On a playground, two swings stand side by side. One child pumps on their own, while the other barely moves until the first gives a push with their foot. Something similar happens in the tropical Pacific and Indian Oceans, except instead of children, there are warm and cold masses of water.
The barometer in the port of Papeete on Tahiti and the one in Darwin, Australia, are separated by 7,400 kilometers. When one shows high pressure, the other often shows low, and this difference, called the Southern Oscillation, drives rainfall from India to Brazil. Predicting it even a month ahead is a problem with a century-long history.
An orchestra plays a complex piece, and each group of instruments enters on its own schedule. The violins might slow down while the woodwinds keep the same tempo, and the percussion might suddenly burst into a roll. The conductor hears everything at once, but pinpointing the exact moment when the flutes, not the cellos, changed rhythm is nearly impossible.
The river that circles Antarctica does not flow in a single channel: it sometimes splits into branches, sometimes merges into one stream. That is what the fronts of the Southern Ocean look like on maps built from satellite data on sea surface height. Previously, these fronts were sought along lines of equal water level, and they seemed to creep slowly southward.
Twice a day, at eleven in the morning and eleven at night, a white balloon with an instrument rises into the sky from a tiny station in San Pietro Capofiume, just eleven meters above sea level. Over twenty-two years, more than sixteen thousand such launches have recorded how air temperature changes with altitude: from the warm ground to the thin cold at twenty kilometers.