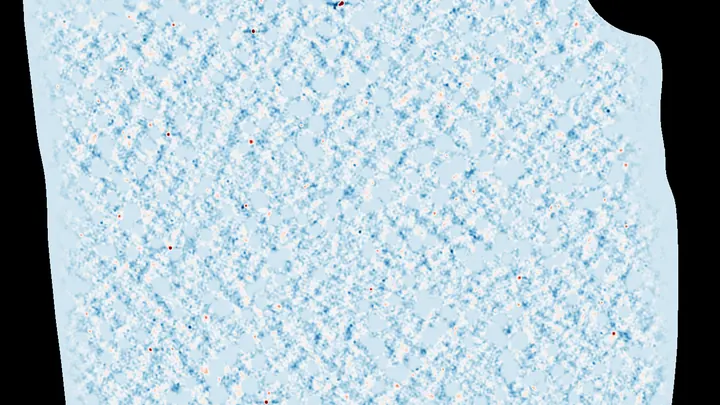
A temperature map is a visual representation of temperature variations across a surface or volume, often rendered as a color-coded image. In astrophysics, the most famous temperature maps are of the cosmic microwave background (CMB) — the faint afterglow of the Big Bang — where tiny fluctuations in temperature (about one part in 100,000) reveal the seeds of all cosmic structure. These maps are also used to study planets, stars, and even medical imaging, where they show heat distribution in tissues.
History
The first CMB temperature map was produced by the COBE satellite in 1992, led by George Smoot and John Mather, who later won the Nobel Prize in Physics for this work.
How it works
Temperature maps are built by measuring radiation emitted or absorbed at specific wavelengths. For the CMB, telescopes scan the sky at microwave frequencies, recording the intensity of radiation from each direction. After removing foreground sources like dust and cosmic rays, the remaining signal is converted into a temperature value for each pixel. The resulting map is often displayed with a color scale, where blue represents cooler regions and red represents hotter ones, making subtle variations visible to the eye.
In practice
Temperature maps are used in meteorology for weather forecasting, in medicine for detecting inflammation or tumors via thermography, and in astronomy for studying planetary surfaces and the early universe.
Fun fact
The CMB temperature map is so uniform that if you scaled it to the size of Earth, the tallest mountain on it would be only about 10 meters high.
An accountant tallies up all the factories, warehouses, and shops, but the balance doesn't add up — half the inventory seems to have evaporated. That's roughly how astronomers have spent decades searching for ordinary matter in the present-day Universe.
The universe is a vast, dark ocean. We see only the glowing foam on its surface — stars and galaxies. But hidden in the depths are two invisible forces: dark matter, which with its gravity keeps galaxies from flying apart, and dark energy, which, on the contrary, pushes space itself apart, making the universe expand faster and faster.
380 thousand years after the Big Bang, the universe cooled enough for light to decouple from plasma. That cosmic microwave background still pervades space, like the first chord of a symphony, the echo of a fiery beginning.
The cosmic microwave background is the petrified light of the first moments. Shortly after the Big Bang, microscopic quantum fluctuations were stretched by inflation to the scales of galactic superclusters.
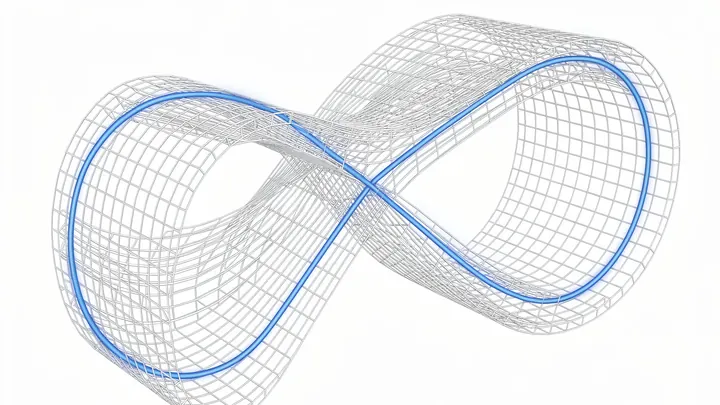
From childhood, we're used to thinking of space as infinite and isotropic. But Einstein and Lemaître were already asking: could the Universe be closed in on itself, like a Möbius strip or a 3-torus?
The cosmic microwave background is the afterglow of the Big Bang, which we see at millimeter wavelengths. But it also has a long-wavelength tail extending into the radio range.
Ancient light, traveling 14 billion years, reaches us from all directions. At first glance, it looks perfectly smooth, but if you look closely, tiny fluctuations appear, like ripples on a still pond. Those ripples aren't random noise; they're an encoded history of the universe.
A flashlight beam glides over uneven glass. The glass is massive galaxy clusters, and the flashlight is ancient light born shortly after the big bang. Passing by such clusters, light doesn't just bend around them like water around a rock. Its path shifts slightly sideways, and the amount of shift depends on how the light is 'twisted'—right or left.
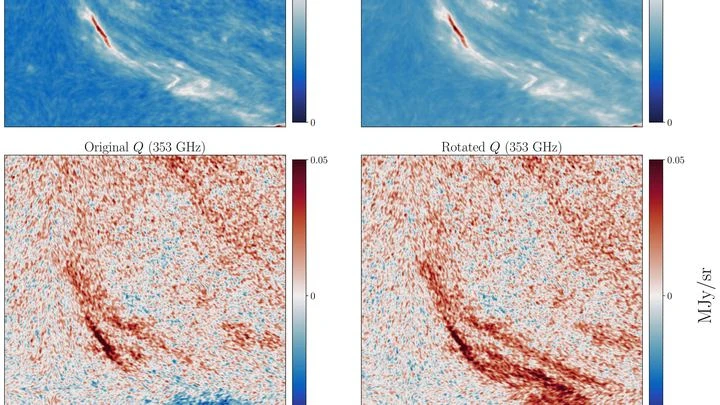
A dust storm that has raged for millions of years is not in a desert but between the stars. There, clouds of tenuous gas drift, threaded by magnetic fields. These fields align dust grains like compass needles along field lines. When such dust emits, its light becomes polarized: it oscillates in a single plane, like a rope shaken only up and down.
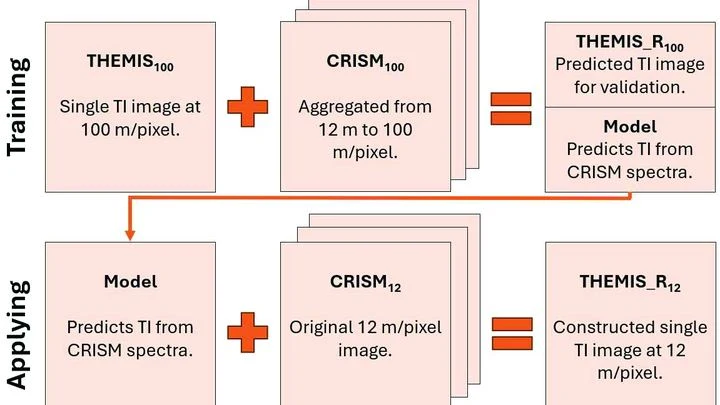
Warm rock and cold sand cool at different rates at night. An instrument orbiting Mars measures this heat, revealing whether the surface is loose dust, a dense crust, or solid rock. But thermal images have a resolution of 100 meters per point: an entire football stadium fits into a single pixel. Fine details (the beds of ancient streams, the edges of lava flows) are simply invisible.
Light that has traveled to us for nearly 14 billion years is like an old photograph whose details emerge with careful processing. The cosmic microwave background (the afterglow of the Big Bang) holds the imprint of the universe's first moments, but its signal is faint and distorted.
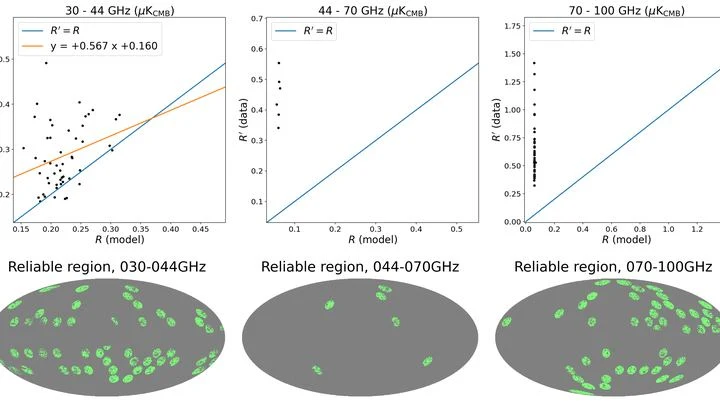
Astronomers are trying to capture the radio echo of the Big Bang — a faint glow that fills the entire universe. But the receiver is choking with noise: our Galaxy is packed with glowing interstellar dust, whose emission can easily be mistaken for a signal from the distant past.
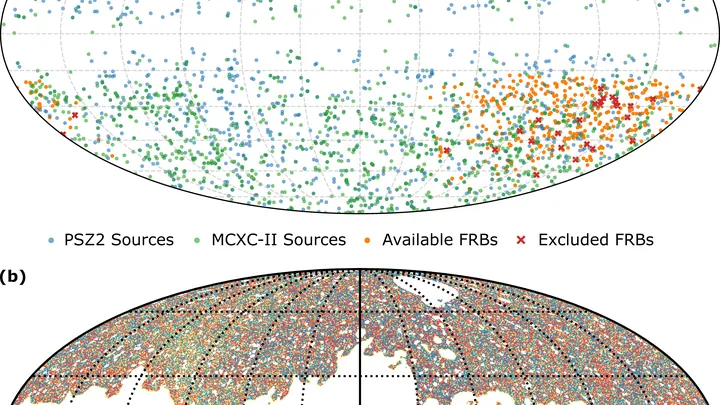
In the frozen desert of Antarctica, the SPT-3G telescope peers deep into the universe. Its target is the ancient microwave radiation left over from the Big Bang. But on its way to us, this radiation passes through giant galaxy clusters filled with scorching gas.
The cosmic microwave background is a faint glow left over from the Big Bang, like the cooling embers of a campfire. It encodes gravitational waves that may have arisen in the first fractions of a second, when the universe inflated faster than light.
Imagine a city map where streets are replaced by car speeds and buildings by the metal content of stars. Such a map can tell you where the center is and where the outskirts are, even without knowing exact distances. This is precisely the approach astronomers took with our Galaxy, using longitude–velocity (ℓ–v) diagrams.
According to the Big Bang theory, developed by Georges Lemaître, the Universe began from a hot dense point and then rapidly expanded — an inflation proposed by Alan Guth. Echoes of that time reach us as a faint glow — the ancient light.