A confusion matrix is a specific table layout that allows visualization of the performance of a supervised learning algorithm, typically a classifier. Each row of the matrix represents the instances in an actual class, while each column represents the instances in a predicted class (or vice versa). The name stems from the fact that it makes it easy to see if the system is confusing two classes (i.e., commonly mislabeling one as another).
History
The term was popularized in the field of machine learning in the 1960s, though the concept of a contingency table in statistics predates it. The exact origin is unclear.
How it works
For a classification problem with N classes, the matrix is N×N. The diagonal cells show the number of correct predictions for each class, while off-diagonal cells show misclassifications. From this table, one can derive metrics like accuracy, precision, recall, and F1-score. For binary classification, the matrix is 2×2 with entries typically called true positive, false positive, true negative, and false negative.
In practice
Used in evaluating and comparing classifiers in fields like medical diagnostics, spam detection, and image recognition, where understanding the types of errors matters more than overall accuracy.
Fun fact
A confusion matrix can be used to compute the Matthews correlation coefficient, which is a single metric that summarizes the entire matrix and is often more informative than accuracy for imbalanced datasets.
Four old maps were lying in different desk drawers. Each one marked genes linked to cellular aging, but the maps did not match: different names, different scales, different legends. A scientist hunting for a gene to test had to cross-check them by hand, at the risk of missing an important mark.
SenSASP stitched those maps into one.
A radiologist looks at an abdominal scan and sees not just organs but their spatial relationships: which kidney is larger, where the tumor lies relative to a vessel. It's like reading a map, where it's not enough to know where a city usually stands; you also need to measure the distance between two points on the ground.
Getting lost in a hall of mirrors is easy: every wall reflects another, and you feel like you've been here before. The brain gets similarly confused when surrounded by many similar places. Neurons responsible for the spatial map can fire the same signal for two different corners of a room. This is called spatial ambiguity.
In a warehouse, there are boxes of apples and pears. There are many apples and few pears. But when the stock clerk says "a fruit with smooth skin," we are somehow more likely to recall the rare pear than the common apple. This is the inverse base-rate effect — a persistent glitch in how the brain resolves ambiguity between categories.
A hundred thousand stars in the dense core of a globular cluster move like steel balls in a giant pinball machine. Each 'bump' — a gravitational encounter between a binary system and a single star — triggers a cascade of unpredictable events.
A child exploring an unfamiliar apartment crawls from object to object and remembers what is visible from each corner. This is how the brain builds a mental map — an internal model of space. The gradCSCG algorithm works on the same principle: it receives a video stream from a camera and independently draws a map of the room, relying only on the changing images.
A robot swarm is like a cloud of fireflies: each moves on instinct to wherever is freer, and chaos turns into order. For a long time, it was a mystery how coherence emerges without communication or commands. The answer came with the creation of the Response Map — a tool that, like an X-ray, illuminates the hidden logic of the machine brain.
Gravitational microlensing is a fascinating cosmic effect predicted by Einstein and developed by Zwicky. A massive body passing between us and a distant star bends its light like a lens, creating characteristic magnifications and distortions.
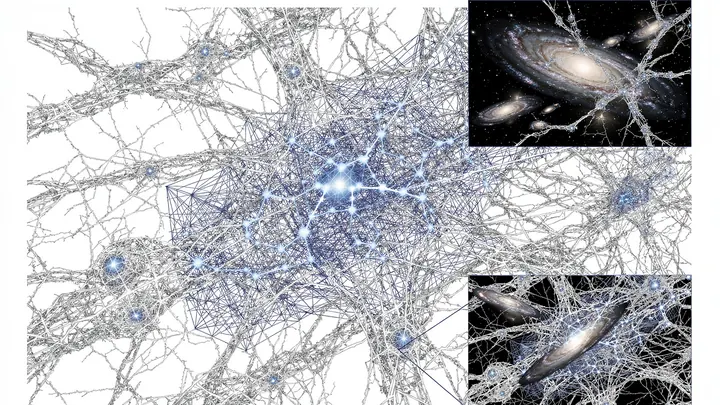
Light from distant galaxies travels to us for billions of years, but along the way it gets bent and twisted by the invisible web of dark matter. This effect, predicted by Albert Einstein within general relativity, is called gravitational lensing.
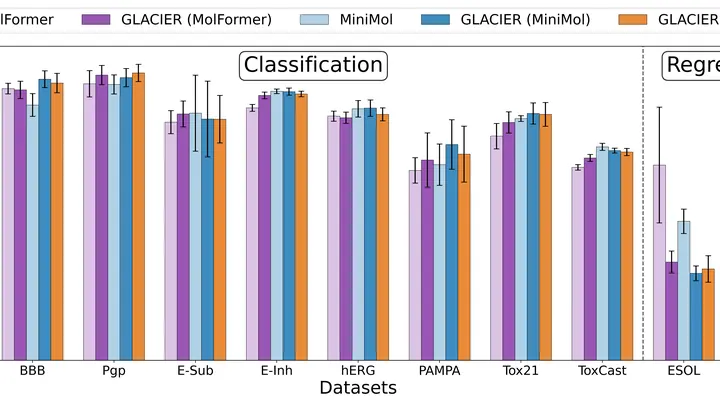
Finding the right molecule among billions of options is like finding a single grain in a sack of rice. To avoid sifting through everything by hand, chemists increasingly turn to neural networks. But large models require powerful computers, while small ones often lack the big picture.
GLACIER tackles this problem like a bright student learning from several mentors at once.
Spacetime is often pictured as a smooth fabric. But at the very microscopic level, this fabric might not be continuous; instead, it could consist of individual 'atoms'—events linked by causality. This picture of the world is called causal set theory.
You're trying a dish at a restaurant, but you haven't seen the menu. You ask the waiter questions — too salty? what spices?—and from the answers you try to guess what kind of chef prepared it.
Show the same photo of a cat to two different neural networks, and they often reach a similar conclusion: "cat." But ask them for more detail, and their answers may diverge. One model focuses on the whiskers, another on the coat color, a third on the pose. So even within the "visual" world of neural networks, there's no complete unity.
A seven-metal alloy is like a team where every player is pulling the blanket their own way. Atoms of iron, cobalt, nickel, aluminum, titanium, tantalum, and vanadium can either fall into a strict pattern or scatter into random positions. This determines whether the material will be as strong as steel or as light as aluminum.
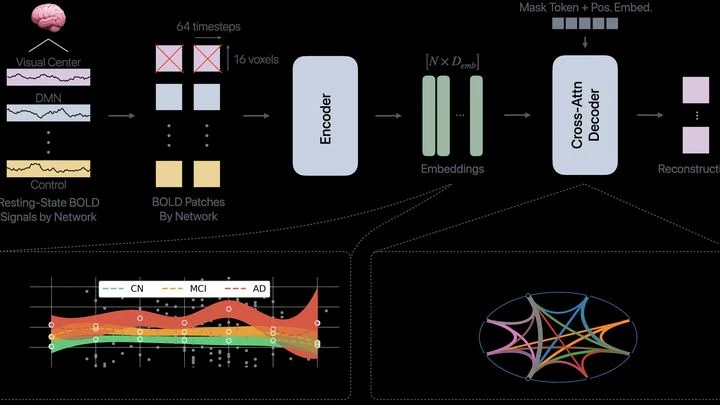
The brain isn't one big computer: it's more like an orchestra, where different groups of musicians play their parts. Neural networks for memory, attention, or emotions are constantly talking to each other. In Alzheimer's disease, this orchestra starts to go off-key: some groups fall silent, others play out of sync.
The heart doesn't beat like a metronome but like a jazz drummer: sometimes it stumbles, skips beats, or races. Atrial fibrillation is one of the most insidious glitches: the atria quiver instead of contracting, and blood can pool, forming clots. Doctors catch this glitch on an ECG — a recording of the heart's electrical signals.