A cumulative sum (CUSUM) control chart is a tool for monitoring a process over time to detect small but persistent changes in its average value. Unlike a simple chart that plots each measurement, it plots the running total of deviations from a target value. This makes even a slight shift in the mean accumulate into a visible trend, alerting you to a change that might otherwise be lost in random noise.
History
The CUSUM technique was introduced by E. S. Page in 1954, building on earlier work in sequential analysis by Abraham Wald.
How it works
You start with a target mean (often the historical average). For each new observation, you add the difference between the observation and the target to a running sum. If the process stays on target, the sum wanders near zero. If the mean shifts upward or downward, the sum drifts steadily in that direction. You set a decision threshold; when the sum crosses it, you conclude a shift has occurred.
In practice
It is widely used in industrial quality control (e.g., monitoring manufacturing tolerances), in clinical trials for early detection of treatment effects, and in environmental monitoring to spot gradual changes in pollution levels.
Fun fact
CUSUM charts are so sensitive that they can detect a shift of just 0.5 standard deviations in the mean with far fewer observations than traditional control charts.
A handful of coins drops onto a table — heads and tails land wherever they please. The same goes for an instantaneous snapshot of a quantum chain: in some places a particle is present, in others it is not. But behind the disorder lurks a precise angle.
In this work, a chain of particles closed into a ring was considered. It was divided into four arcs: two were measured, two were left untouched.
A group of robot explorers is like a team of cooks tasting the same dish. Each samples their own portion and shares an impression: clear, occupied, or uncertain. But tastes are subjective — one might miss a chair leg, another might only lick the edge.
When a pipe bursts in the basement, a plumber acts step by step: locates the leak, measures the pressure, determines the cause, patches it up, and checks if it's dry. The same recipe — the standard model DMAIC — is being proposed against epidemics.
First, they determine the scope — how many hospital beds are occupied, which industries are sagging.
Imagine a quantum phase transition as an intricate dance. Electrons whirl in strict order, each step representing their spatial arrangement, and the rhythm their dynamics. For decades, physicists could only see a blur of motion, unable to tell if the figures were changing or the music speeding up.
The atom is like a conductor, and the light in the resonator is the orchestra. Their energy exchange, known as the Jaynes–Cummings interaction (part of the Standard Model), lets the atom use “baton” strokes to change the rhythm and timbre of the oscillations.
A heat engine doesn't have to be made of iron. In the microworld, a single electron can play the role of a piston, and the measurement process itself can serve as fuel. Two neighboring 'pockets' for electrons are connected by a narrow bridge.
If you check where an electron is every second, its quantum properties change. It's like a child playing hide-and-seek but constantly being called by name: they freeze and stop running. In the particle world, such a "caller" is a measurement. It prevents particles from freely forming a shared quantum state, or entanglement.
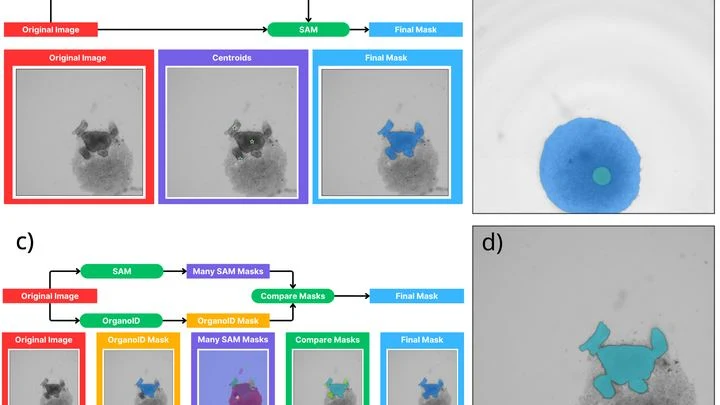
A biologist looks through a microscope at dozens of tiny cell spheres — spheroids. From these, miniature organ-like structures will later grow. The task is similar to a baker's job of checking whether the dough has risen evenly in each mold. Only here, instead of molds, there's a nutrient medium, and instead of dough, there are living cells.
A doctor holds a stack of test results taken at different times. Each sheet on its own is just a snapshot of a single day, but what you want is a whole movie of how the disease unfolded. A neural network called Tempo learns to glue these scattered frames into a smooth reel.
The heart beats steadily, then slips into arrhythmia. The climate holds its familiar rhythm for decades, then shifts to a new state over a single summer. Such regime shifts are like a flick of a switch, but in real data we see only a noisy one-dimensional signal in which the moment of the break is hidden.
The heart beats, and on a paper ECG strip, each beat looks like a sharp spike with two humps: a quick rise, then a smaller wave, then a descent. A doctor looks at such a strip and sees the rhythm, but the shape of each spike, how exactly the muscle contracted, is hard to discern, especially if the recording lasts a full day.
This new method turns that strip into a colorful carpet.
Your back hurts, and the doctor asks you to bend forward and backward to see how your vertebrae move. Usually, this means a series of X-rays: they show motion, but only in a plane, like a shadow on a wall. And volumetric methods like CT scans can't keep up with movement.
Engineers proposed a different approach: a robot sweeps an ultrasound probe over your back while you bend.
A quantum computer is like an orchestra where each qubit is a musician, and a measurement is the conductor's attempt to hear who played what. But the hall is noisy: the signal fades like sound through a thick wall, and the conductor himself sometimes mixes up the notes.
The quantum world is full of surprises: even simply observing a particle changes its behavior. In a new study, physicists showed that continuously measuring energy can make quantum chaos more pronounced. They used a quantity that indicates how long a quantum state remains similar to itself under repeated measurements.
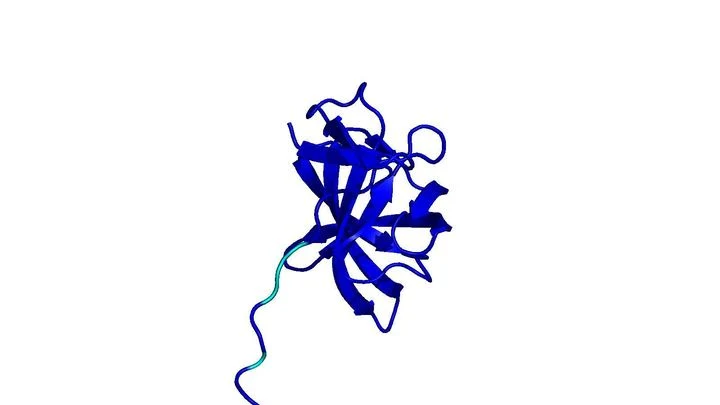
A protein language model is like a chef who learned from thousands of recipes and now invents new dishes. Sometimes he gets carried away and salts every dish because one good cookbook used a lot of salt. In proteins, such repetition isn't just ugly: identical stretches in the chain make the protein fragile, it can't fold into the right shape, and it doesn't work.
A quantum computer is like an orchestra where each musician plays their own part but sometimes hits a wrong note. To keep the music from turning into cacophony, you need a conductor who corrects mistakes in time. In quantum computing, the role of the conductor is played by error-correcting codes.
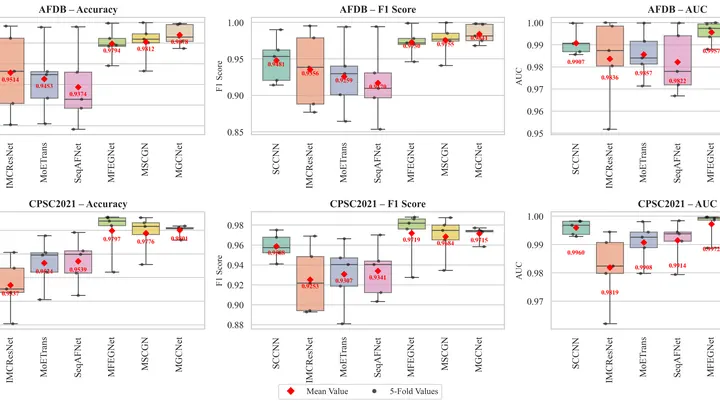
The heart doesn't beat like a metronome but like a jazz drummer: sometimes it stumbles, skips beats, or races. Atrial fibrillation is one of the most insidious glitches: the atria quiver instead of contracting, and blood can pool, forming clots. Doctors catch this glitch on an ECG — a recording of the heart's electrical signals.