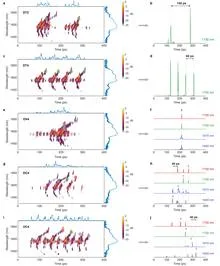
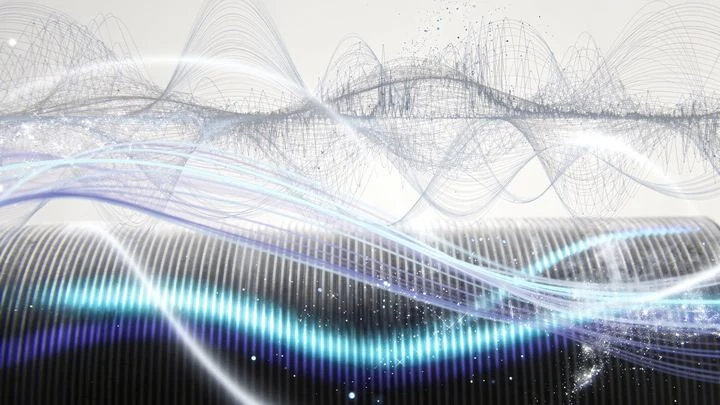
A spectrogram is a visual representation of how the frequency content of a signal changes over time. Instead of showing a single waveform, it displays a two-dimensional image where one axis represents time, the other represents frequency, and the brightness or color at each point indicates the intensity (amplitude) of that frequency at that moment. This makes it an incredibly powerful tool for analyzing sounds, radio waves, and any other signal that varies in time, revealing patterns that are invisible in the raw waveform.
History
The concept evolved from early sound analysis techniques in the mid-20th century, particularly with the development of the sound spectrograph at Bell Labs in the 1940s, which was used for speech analysis.
How it works
The signal is divided into short overlapping time segments. Each segment is then processed with a mathematical operation called the Fourier transform, which decomposes it into its constituent frequencies. The resulting frequency magnitudes are plotted as a vertical column of colored pixels, and these columns are placed side by side to build up the full spectrogram image over time. This process is often called a short-time Fourier transform (STFT).
In practice
Spectrograms are used in speech recognition, music analysis, sonar and radar, medical imaging (like ultrasound), and as input data for neural networks that process audio or other time-varyingsignals.
Fun fact
Spectrograms can be used to hide secret messages in audio files, a technique known as audio steganography, where an image is embedded as a spectrogram that only appears when the audio is analyzed.
A conductor raises the baton, and the orchestra produces not just sound but a complex score: each note sounds at its own moment, at its own pitch, with the right volume. Light can also be a score, if you control its spectrum and timing. Previously, this required bulky setups that could not be reconfigured after assembly.
2,41 hours. That's exactly how long a day lasts on SIMP 0136 — a lonely planet-like object 6,1 parsecs away. That's twice as far as Proxima Centauri. Its mass ranges from 12,7 to 17,8 Jupiter masses, placing it on the boundary between planet and star.
A protein in a cell is not a frozen sculpture. It is constantly in motion: bending, breathing, jittering. This motion, its dynamics, determines how the protein works. But peering directly into the dance is hard, and computer simulations often demand enormous computing power.
A new approach, named DynaMode, views protein motion as a musical piece.
When the conductor leaves the orchestra, the musicians keep playing from memory for a while. But without a unified rhythm, each one starts to speed up or slow down on their own, and the harmonious symphony turns into disjointed noise. According to new research, the brain and heart behave much the same way in the last hours of a person's life.
An ultra-sensitive microphone listens not to sound, but to the trembling of space itself. That's how gravitational wave detectors work — LIGO, Virgo, KAGRA.
Two ultra-dense stars spiral around each other and eventually collide. This dance lasts only moments, but it sends powerful ripples through space — gravitational waves. After the merger, a rapidly spinning blob remains, ringing like a bell, and that ring carries information about what the stars were made of.
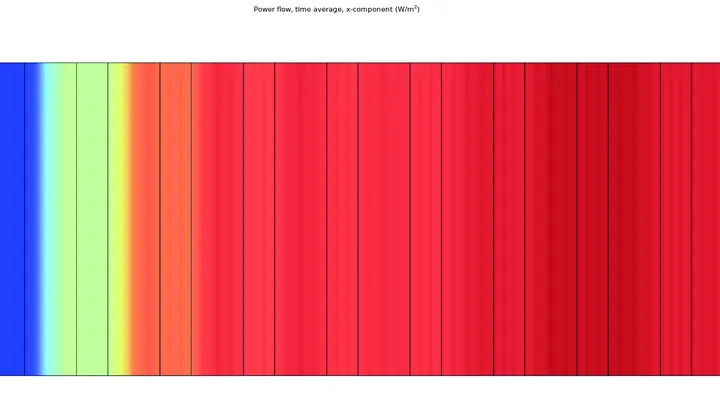
A pebble tossed into a pond sends ripples spreading in all directions. Now imagine the pond itself suddenly turning into jelly — instantly, faster than the wave can complete a single crest. Some ripples would keep spreading but change their spacing, while others would unexpectedly turn around and run back toward the point of impact, as if time were flowing backward for them.
A squad of soldiers marches across a parade ground. As long as everyone keeps in step, the movement remains sharp and coordinated. But if someone falls out of line, the order is lost. In the microworld, electrons play the role of such a squad: when their oscillations are synchronized, the substance emits a narrow, sharp line.
Gravitational wave detectors work like sensitive microphones, picking up the trembling of space from distant cosmic catastrophes. When two black holes merge into one, the newborn object rings like a bell, and that ringing is a unique 'voice' of gravity.
A clock isn't just hands. Every atomic nucleus is a natural metronome: it oscillates with nearly perfect regularity. If you lift one such metronome a couple of meters, its rhythm speeds up ever so slightly — that's time warping, as predicted by Einstein.
A regular camera captures the world as a series of frames: twenty-four, sixty, or even a hundred images per second. That's enough for filming a falling drop, but inside a living cell, events unfold a thousand times faster. Protein molecules carry cargo, membranes bubble, ions slip through channels — all in fractions of a millisecond.
Strike a tuning fork, and it rings with a single pure note. But if the fork is trembling and people are chattering nearby, the sound won't be perfect. Same with molecules: each one absorbs light of a specific color, but due to its own vibrations and the jostling of neighbors, that color gets smeared out.
The authors of the paper figured out how to show this to students without complex formulas.
A beam of light passing through a transparent plate usually keeps its color. But if you stack the plate from thin alternating layers, it becomes a grating that reflects and transmits waves selectively. This has long been used in lasers and optical filters. Now such gratings have been made to vibrate, and light started changing color.
The heart beats, and on a paper ECG strip, each beat looks like a sharp spike with two humps: a quick rise, then a smaller wave, then a descent. A doctor looks at such a strip and sees the rhythm, but the shape of each spike, how exactly the muscle contracted, is hard to discern, especially if the recording lasts a full day.
This new method turns that strip into a colorful carpet.
An ordinary comb parts hair into even strands. A laser 'comb' does the same to light: it emits not one color but thousands, spaced at exactly equal frequency steps. Such a tool has already helped measure time to billionths of a second and peer inside atoms.
A chemical map of a sample is like a mosaic: each point has its own color, its own chemical composition. To assemble such a mosaic, a spectromicroscope scans the sample point by point, recording a spectrum at each location — a "fingerprint" of how the material absorbs or emits light.
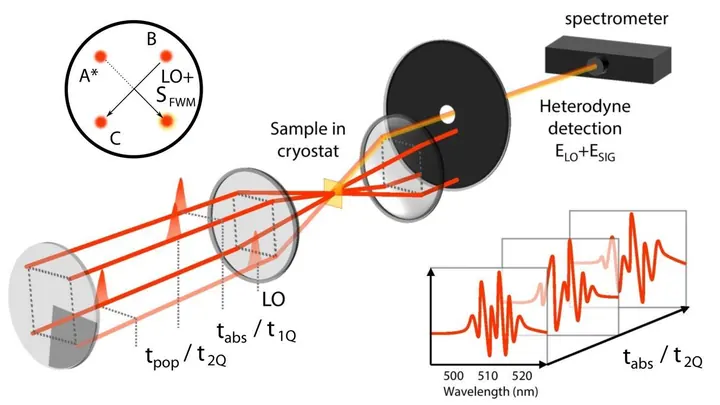
A conventional spectrometer is like a comb that untangles light and sorts it by wavelength. But a comb is rigid: one type of light needs one comb, another needs a different one. The new device works differently. It asks light a series of questions, changing its shape each time to glean more meaning from the answers.
Sound can do more than be heard: it can push. An ultrasound vortex is a sound wave twisted like a whirlpool in a shell: silence at the center, rotating pressure at the edges. Such a whirlpool can grab tiny particles and carry them without a touch.
Light is like a many-voiced choir: color, direction of oscillation, and instantaneous changes all intertwine. An ordinary camera hears only one voice, while the rest are lost. Scientists have built a camera that listens to the entire choir at once, and from a single image understands what is happening.
Graphs are considered identical if their 'terrain' matches. Imagine two maps with mountains and valleys: even if drawn differently, the heights and steepness of slopes can be the same.
A fractal that looks like a butterfly hides an order that is not visible at first glance. In the quantum world of one-dimensional quasicrystals described by the Komoto model, the energy spectrum forms a whimsical shape: the Komoto butterfly.
In 2008, a group of physicists spent months of supercomputer time to compute a single quantity in quantum gravity theory. This is the vertex amplitude of spinfoam, a number that sets the probability of a local quantum transition of spacetime.