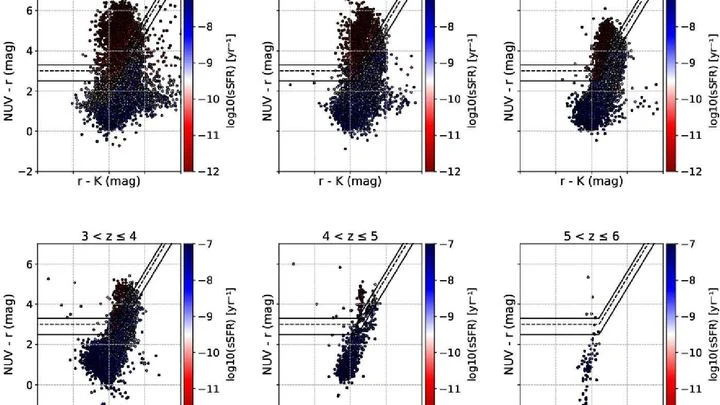
A color-magnitude diagram (CMD) is a scatter plot that places stars according to their absolute magnitude (brightness) on one axis and their color index (temperature proxy) on the other. It is the observational equivalent of the Hertzsprung-Russell diagram and serves as a powerful tool for determining the age, distance, and evolutionary stage of star clusters. By comparing the positions of cluster stars to theoretical models, astronomers can read off the cluster's age and chemical composition.
History
The diagram's roots trace to Ejnar Hertzsprung and Henry Norris Russell in the early 1910s, who independently plotted stellar luminosity against spectral type. The color-magnitude form became standard with the advent of photoelectric photometry in the mid-20th century.
How it works
Stars in a cluster form at roughly the same time and distance, so their positions on a CMD trace a single isochrone — a curve predicted by stellar evolution models. The main sequence turnoff point, where stars leave the hydrogen-burning phase, is a direct age indicator: older clusters have fainter, redder turnoff points. The color index (e.g., B−V) measures temperature, while the magnitude measures luminosity; combining both yields a stellar mass estimate. Distance is inferred by comparing apparent and absolute magnitudes, using the cluster's known properties.
In practice
CMDs are used to date globular clusters (yielding the age of the universe), map the Milky Way's star-forming regions, and identify stellar populations in external galaxies, including those observed by JWST.
Fun fact
The turnoff point of the oldest globular clusters, at about 13 billion years, provides a lower limit on the universe's age that must be consistent with cosmological measurements — a classic cross-check of the Big Bang model.
A young star cluster resembles an orchestra before a concert: each instrument tunes up in its own way, and the overall hum seems like chaos. But if you listen closely, you can pick out individual notes.
15 175 107 stars. Each one got an age. But no number is free of uncertainty: a star's age isn't a nail hammered into the timeline: it's a probability cloud, a fog hiding the true value. For galactic evolution, such a timestamp is priceless: without it, the map of the Milky Way remains flat.
A star's age is the key to the galaxy's history. But prying that key from nature is no simple task: unlike a tree, a star doesn't grow annual rings. Yet, its atmosphere holds a chemical code — the ratio of elements that slowly shifted as generations of stars died and new ones were born.
The first two billion years after the Big Bang were an era when the universe resembled a boiling construction pit. Dark matter clumped the gas together, igniting the first stars. It seemed there simply wasn't enough time to assemble massive elliptical galaxies—'dormant' stellar metropolises — from this raw material.
The universe keeps a tally of every newborn star. Over 13.8 billion years, galaxies have ignited so many stars that their 'census' can reveal the nature of the cosmos itself, just as tree rings reveal past climates.
The Sun is not a perfectly steady lightbulb. Its brightness quivers slightly: it dims a bit, then brightens. For Earth's climate, even slow variations stretched over thousands and millions of years matter. They could have left their mark in the geological record of the last 540 million years.
Astronomer [scientist:A. M.
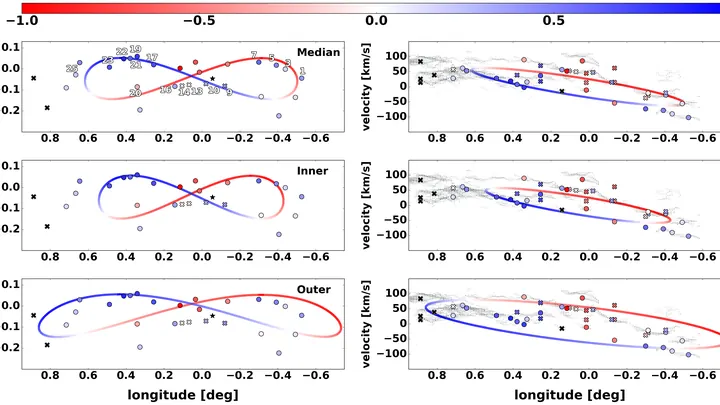
In the very center of the Milky Way, hidden behind a thick veil of dust, lies a giant accumulation of gas — the Central Molecular Zone. You can't see it with the naked eye: dust absorbs visible light, much like dense fog hides the lights of a city.
A galaxy is like a giant merry-go-round: stars and gas whirl around the center, and their speeds reveal how much stuff is on the ride. If we only saw the luminous matter, the outer parts would spin slower than observations show. So there must be invisible mass, dark matter, that holds the galaxy together.
Light from a distant star cuts through dust like a flashlight beam through fog. Dust holds back blue rays more than red ones, making the star appear redder than it really is. From this reddening, astronomers gauge how much dust lies in the light's path.
Globular clusters are dense stellar archives, where the youth of the Galaxy is recorded. But reading this chronicle was hindered by imprecise chronometers: age estimates diverged by a billion years.
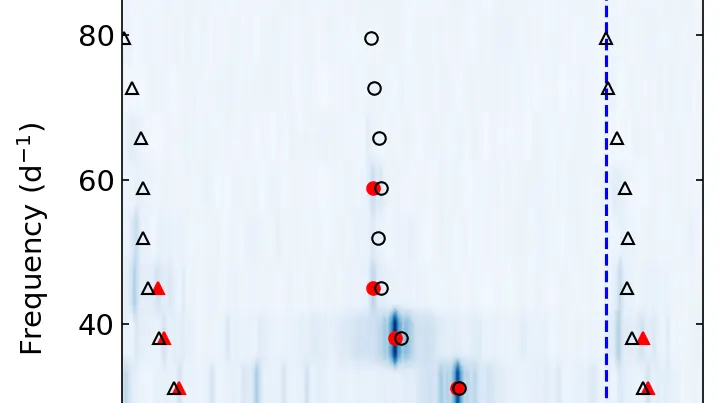
A hot star in its death throes trembles like a plucked string. Its surface oscillates with amplitudes of thousandths of a magnitude, like noticing a light bulb in a room flicker 0.3% brighter. For a space telescope, such precision is routine, but from Earth, the atmosphere gets in the way.
The light of every star is its unique passport, but the entries are written in the language of spectra and colors. For old giants, such documents are almost indistinguishable: their spectra overlap, and deciphering the details by hand was practically impossible.
The brain is like a sprawling city: districts-regions communicate via streets-neural pathways. If traffic lights at an intersection fail, traffic grinds to a halt. Similarly, in the brain, when bundles of nerve fibers (white matter) malfunction, distant regions stop working in concert, and thought stalls.
In distant galaxies, old stars swell and redden. Among them are two groups that act like lighthouses: some have just ignited helium burning, while others are already burning carbon and oxygen.
If you spill a handful of colorful beads on the floor, they will land differently: some will clump together, others will scatter into corners. Roughly the same way, galaxies of different colors (blue, green, and red) are scattered across the universe. Scientists decided to measure how 'clumpy' their distribution is using a number called the fractal dimension.
Light from a streetlamp passing through blinds flickers: the stripes shift, and brightness rises and falls. From that rhythm, you can guess how wide the lamp is. The new method for measuring stars works similarly: instead of capturing a sharp image, astronomers monitor the "twinkling" of light collected by two or more telescopes simultaneously.