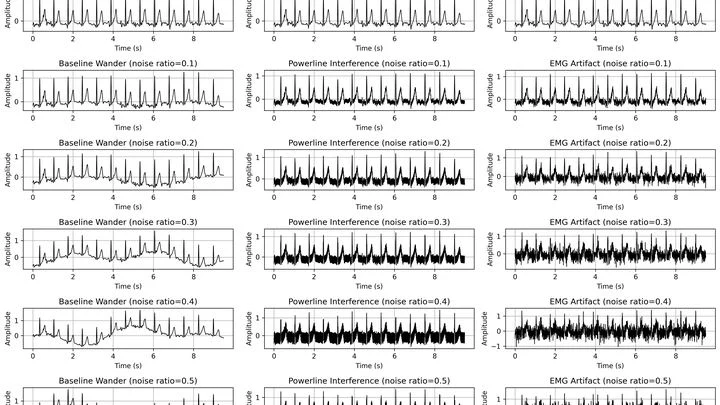
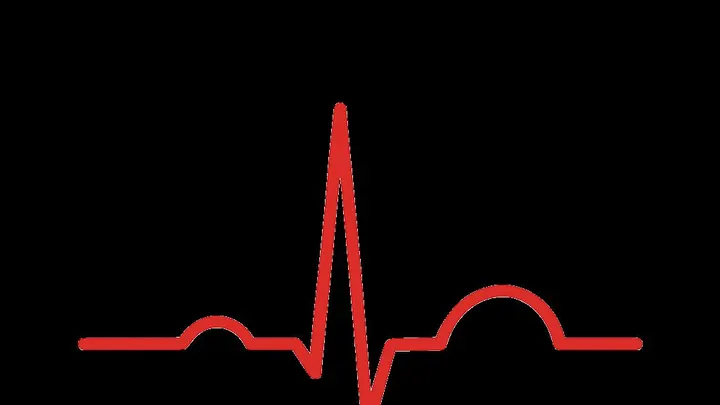
An electrocardiogram (ECG or EKG) is a recording of the electrical activity of the heart over time, obtained by placing electrodes on the skin. Each heartbeat generates a characteristic waveform — the P wave, QRS complex, and T wave — corresponding to the depolarization and repolarization of the atria and ventricles. Clinicians use ECGs to diagnosearrhythmias, heart attacks, electrolyte imbalances, and other cardiac conditions, making it one of the most widely used medical tests worldwide.
History
The first human electrocardiogram was recorded by Augustus Waller in 1887, but the modern clinical ECG was developed by Willem Einthoven in the early 1900s, who also introduced the standard limb leads and the PQRST nomenclature.
How it works
The heart's electrical activity originates in the sinoatrial node, a natural pacemaker that sends a wave of depolarization through the cardiac muscle. This electrical signal spreads through body tissues and reaches the skin, where electrodesdetect tiny voltage differences (on the order of millivolts). The ECG machine amplifies and filters these signals, displaying them as a voltage-versus-time trace. Abnormalities in the timing or shape of the waveform reveal underlying issues — for example, a prolonged QT interval indicates a risk of dangerous arrhythmias.
In practice
ECGs are used in hospitals, ambulances, and wearable devices (smartwatches) to monitor heart rhythm, detect silent heart attacks, and guide treatment of conditions like atrial fibrillation.
Fun fact
A single ECG recording contains about 1,000 data points per second, yet a trained cardiologist can spot a life-threatening arrhythmia in under 10 seconds.
An electrocardiogram is like a recording of a conversation where the heart whispers and a construction site roars in the background. Atrial fibrillation, where the atria quiver instead of contracting, changes that whisper almost imperceptibly.
Catching light one particle at a time is like hearing a whisper in a roaring factory. An electron-multiplying camera (EMCCD) can do exactly that: it turns a single photon hitting a pixel into an avalanche of electrons that can be measured. These cameras are mounted on telescopes to spot a barely visible planet next to a dazzling star.
A doctor places a stethoscope on the chest and listens: lub-dub, lub-dub. The rhythm is there, but how do you measure it when it's noisy around and the patient can't lie still? Conventional devices look for sharp peaks in the heartbeat recording, like catching hammer blows. But if the hammer hits a pillow instead of an anvil, the peaks blur and the device gets lost.
CORAL, the new method, works differently.
The heart sometimes loses its rhythm, like an orchestra where the violins suddenly start playing each on their own. Cardiologists in such cases look for the "out-of-tune" areas by reading the heart's electrical signals and precisely ablating them with a thin probe — a catheter.
The open archives OpenNeuro and NEMAR hold 791 recordings of the brain's electrical activity from nearly forty thousand people. In total, that's 86,051 hours of signals — roughly ten years of continuous listening. Previously, to take even one such recording off the shelf, you had to write thousands of lines of code: download, unzip, fix format errors, and slice it into chunks of the desired length.
When the conductor leaves the orchestra, the musicians keep playing from memory for a while. But without a unified rhythm, each one starts to speed up or slow down on their own, and the harmonious symphony turns into disjointed noise. According to new research, the brain and heart behave much the same way in the last hours of a person's life.
After a heart attack, the dead section of heart muscle can be replaced with living cells grown from stem cells. But a common problem arises: the fresh transplant starts acting as its own pacemaker, and the heart falls out of its proper rhythm. Doctors see the arrhythmia on an ECG, but what exactly happens at the junction between 'self' and 'foreign' remains hidden.
The heart beats like a drum in the next room: from the rhythm and the dullness of the thump, an experienced physician can guess whether there’s an enlarged chamber, a thickened wall, or a valve flapping out of sync. But to see it for sure, the patient lies on a couch while a probe glides across the chest — echocardiography (heart ultrasound).
A person hears a ringing that isn't there. The doctor asks them to describe it — loudness, pitch, persistence. But it's subjective: one might say "like a mosquito," another "like steam from a kettle." We need a way to see tinnitus directly, in the brain itself.
Each heartbeat can be drawn as a point on a sheet of paper. Thousands of these points merge into a cloud. The Mapper algorithm turns this cloud into a network: it connects points that behave similarly and colors them according to blood flow strength. The result is not just a pile of numbers but a colored map showing which parts of the heart work in sync and which are out of step.
Your finger is a living sensor: beneath the skin, arteries pulse in time with your heart. Traditional blood pressure cuffs squeeze your arm and give a single number, but this ring uses eight electrodes to pass a weak current through the tissue and map blood flow.
You sleep, but your heart keeps telling stories. The rhythm of beats, the pauses between them, the respiratory waves — all shift from one sleep stage to the next. In a sleep lab, this is read from a host of sensors on the head, face, legs, and chest. It's cumbersome, expensive, and not something you can do at home.
Potassium in the blood is like salt in a soup: just a bit too much, and the heart starts to falter. Doctors usually monitor this mineral with blood draws from a vein, but for people with kidney disease or a weak heart, frequent lab visits become a ordeal.
The heart doesn't contract all at once but as a wave: an electrical signal travels through the muscle, and behind it, like ripples spreading on water, a contraction rolls through. In arrhythmia, this wave goes awry: it stalls in one spot, loops in another, and the pump starts working in a disorganized way.
Depression is sometimes sought in the brain's electrical waves. The logic is simple: if a disease has stages (acute, maintenance, recovery) then the signals should change gradually, like volume when you turn a knob. Researchers took EEG recordings from 74 people: 24 in the acute phase, 23 in the maintenance phase, and 27 healthy.
The heart beats irregularly. Standard MRI pretends all beats are the same: it stacks them on top of each other, like a photographer shooting a dancer with a long exposure. The result is a blurry smudge — pretty, but useless if you need to see each individual movement.
The new approach films the heart like a video: frame by frame, with no gaps.
An electrocardiogram is like a recording of an engine's hum: an experienced mechanic can hear when something's off. A heart ultrasound shows the engine itself from the inside, but the machine is pricey and specialists are scarce.
An electrocardiogram is like a long strip of paper on which the heart leaves its signature. A doctor studies it to catch rhythm disturbances, but when the recording lasts for days, the strip stretches for miles. The eye tires, attention wanders, and rare but dangerous irregularities can slip by.
AI-HEART works like a tireless assistant that scans the entire strip without a break.
The heart beats, and on a paper ECG strip, each beat looks like a sharp spike with two humps: a quick rise, then a smaller wave, then a descent. A doctor looks at such a strip and sees the rhythm, but the shape of each spike, how exactly the muscle contracted, is hard to discern, especially if the recording lasts a full day.
This new method turns that strip into a colorful carpet.
An ECG is not just a wavy line on paper. Like a diary, it records the state of the entire heart: rhythm, wall thickness, and hints of future problems. But currently, programs that learn to read this diary are trained on very narrow tasks — mostly detecting arrhythmias. That's like teaching someone to understand a book by showing them only a list of typos.
At night, a person breathes, and the rhythm of that breathing can tell you a lot about their sleep. But usually, doctors look at the brain's electrical waves — recorded by sensors on the head. New work shows how to reconstruct those waves from breathing alone, without touching the head.
The model acts as a translator from the language of the body to the language of the brain.
Every thought leaves a trace — a faint electrical blip on the scalp. A device with dozens of wires, resembling a swim cap, catches these traces and turns them into wavy lines. From those lines, you can guess what a person feels even if they stay silent. In a new study, three computer programs competed to see which could read such lines most accurately and determine whether the mood was bad, neutral, or good.
A heart cell in a Petri dish contracts, and at that moment, an electrical wave sweeps across its surface. Previously, to catch that wave, you had to poke the cell with an ultra-fine electrode needle. Now, you just look at it under a microscope.
The method is called electrochromic recording.
A tiny defect in diamond is like a microscopic ear, able to pick up the magnetic 'breath' of the heart. Such sensors work at room temperature and are no bigger than a grain of sand.
Magnetic resonance is like a tuning fork that rings only at its own note. Each molecule has its own frequency, and from that you can tell what the molecule is and what state it's in. But previously, this tuning fork was listened to through a thick wall: the signal was blurred, and you couldn't make out the exact note.
The heart doesn't beat like a metronome but like a jazz drummer: sometimes it stumbles, skips beats, or races. Atrial fibrillation is one of the most insidious glitches: the atria quiver instead of contracting, and blood can pool, forming clots. Doctors catch this glitch on an ECG — a recording of the heart's electrical signals.
An electrocardiogram is like a musical score, where each note is a heartbeat. A doctor hears the melody and spots the off-notes — arrhythmia. But listening to the score for hours is tiring, so a smart monitor is placed by the patient's bedside.