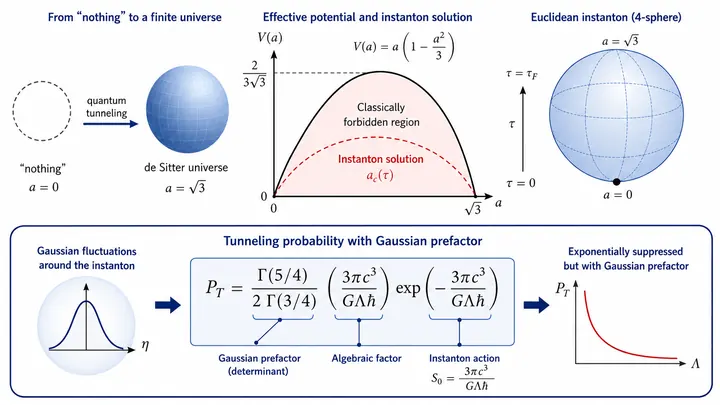
A probability distribution characterized by a bell-shaped curve, often used to model random fluctuations.The Gaussian distribution, also known as the normal distribution, is a probability distribution that describes how values cluster around a central mean. Its graph is the familiar symmetric bell-shaped curve, with most observations near the average and progressively fewer in the tails. It is the default model for random fluctuations in countless natural and social phenomena, from measurement errors to biological variations.
Introduced by Carl Friedrich Gauss in 1809 in his work on celestial mechanics and least squares, though earlier uses by Abraham de Moivre and Pierre-Simon Laplace are known.
The distribution is defined by two parameters: the mean (the peak's location) and the standard deviation (the curve's width). The probability density function is a specific exponential formula that ensures the area under the curve equals 1. Because of the central limit theorem, the sum of many independent random variables tends toward a Gaussian, even if the individual variables are not Gaussian themselves.
Used in virtually every field of science and engineering for error analysis, hypothesis testing, and signal processing; in physics, it describes thermal noise and the distribution of particle velocities in a gas.
The Gaussian distribution is sometimes called the 'normal' distribution, but it is anything but typical in nature — many real-world distributions have heavier tails than a Gaussian.